
The shading impact of trees on the energy consumption of buildings, and in particular solar systems is not easy to estimate. With support from the Lincoln Electric system and the U.S. Department of Energy a project was started to monitor deciduous trees, both summer and winter for two years. The project was designed to provide data on widely used tree species in the Midwest. At the present time, information on the effectiveness of deciduous trees to provide shade in the summer but also allow sunlight penetration in the winter is minimal.
This project measured solar radiation penetration through the canopy of six trees twice a year for two years. Sites were selected which contained ‘modern’ healthy tree species which were currently popular and available from nurseries. They were also selected for uniformity in size, age and accessability for monitoring. Both the Lincoln and state forestries were very helpful in the selection and location of these trees.
It is essential when monitoring sunlight penetration through the tree canopy that the measurement reflect the average condition. Wide variations in measurements were experienced due to bare branches, wind, sun flecks and reflection from the surroundings. A mobile, track mounted thermopile type pyranometer was used to measure a grid 9 readings wide and 7 readings long each hour under the tree canopy. Another pyranometer was located in the full sun outside the tree canopy and a battery powered data logger intercepted three readings over 30 seconds for each sensor. A battery powered ‘tank’ programmed to stop every 4.3 ft. for 30 seconds provided the locomotion. In this fashion, 63 readings in a grid pattern were obtained each hour for 6 to 8 hours per day. The track was moved after each ‘run’ (9 readings) through the shade or 7 times each hour. The readings were recorded on an audio tape recorder connected to the data logger. Each day’s data was then played through an analog to digital converter and stored on computer tape for further analysis.
The data were analyzed from three viewpoints both summer and winter. First was how many watts per square meter was being blocked by the tree. This varied continuously from tree to tree, time of year, time of day and location within the tree itself. Although this information is in itself of great value to plant scientists it was not of central concern to the project. The following charts show the amount of solar radiation blocked by a sycamore tree in the full leaf condition (Fig. 1). These figures show a blockage of about 700 watts per square meter during the summer. A similar hour for the winter shows a 350-450 w/m2 blockage. Of interest is the general uniformity (except for sun flecks) of blockage both top to bottom and side to side within the tree canopy.

What we are more interested in for design purposes, however, is the amount of solar radiation penetrating the canopy. Figure 2 and 3 show these figures are in the range of 500-600 w/m2 during the bare branch condition and typically less than 100 during the full leaf condition. Of even more interest for designers in applying this information to other locations with trees of this type is a percentage figure.

| REC | SOLAR | SR#l | SR#2 | RUN DIST | X | Y | Z1 | Z2 |
|---|---|---|---|---|---|---|---|---|
| NO. | TIME | WT/M | WT/M | FT. | FT. | FT. | WT/M | Z |
| 127 | 1008 | 770 | 727 | -5 | -8.73 | -15.64 | -43 | -5.92 |
| !28 | 1008 | 778 | 727 | “J | -5.67 | -12.62 | -51 | -7.00 |
| 129 | 1009 | 794 | 730 | -5 | -2.66 | -9.59 | -64 | -8.83 |
| 130 | 1009 | 209 | 731 | -5 | .42 | -6.58 | 522 | 71.37 |
| 131 | 1010 | 129 | 732 | -5 | 3.47 | -3.60 | 603 | 82.37 |
| 132 | 1010 | 211 | 731 | -5 | 6.57 | -.61 | 521 | 71.22 |
| 133 | 1011 | 187 | 732 | -5 | 9.67 | 2.32 | 545 | 74.51 |
| 134 | 1011 | 140 | 732 | o5 | 12.78 | 5.29 | 592 | 80.84 |
| 135 | 1012 | 550 | 733 | -5 | 15.94 | 8.18 | 183 | 25.01 |
| 136 | 1014 | 772 | 738 | 0 | -12.64 | -11.67 | -34 | -4.61 |
| 137 | 1015 | 767 | 738 | 0 | -9.53 | -8.70 | -30 | -4.01 |
| 138 | 1015 | 281 | 738 | 0 | -6.35 | -5.80 | 457 | 61.93 |
| 139 | 1016 | 95 | 740 | 0 | -3.19 | -2.88 | 645 | 87.15 |
| 140 | 1016 | 185 | 741 | 0 | 0.00 | 0.00 | 556 | 75.05 |
| 141 | 1017 | 378 | 742 | 0 | 3.21 | 2.86 | 364 | 49.04 |
| 142 | 1017 | 380 | 741 | 0 | 6.42 | 5.73 | 361 | 48.74 |
| 143 | 1018 | 461 | 741 | 0 | 9.68 | 8.53 | 281 | 37.86 |
| 144 | 1018 | 766 | 742 | 0 | 12.90 | 11.38 | -24 | -3.19 |
| 145 | 1023 | 783 | 745 | 8 | -18.34 | -4.84 | -38 | -5.14 |
| 146 | 1023 | 781 | 746 | 8 | -15.03 | -2.09 | -35 | -4.68 |
| 147 | 1024 | 312 | 747 | 8 | -11.72 | .72 | 435 | 58.26 |
| 148 | 1024 | 63 | 749 | 8 | -8.40 | 3.45 | 686 | 91.61 |
| 149 | 1025 | 57 | 750 | 8 | -5.04 | 6.21 | 694 | 92.47 |
| 150 | 1025 | 65 | 751 | 8 | -1.70 | 8.92 | 686 | 91.41 |
| 151 | 1026 | 66 | 751 | 8 | 1.71 | 11.62 | 685 | 91.20 |
| 152 | 1026 | 74 | 753 | 8 | 5.06 | 14.31 | 679 | 90.20 |
| 153 | 1027 | 385 | 754 | 8 | 8.52 | 16.95 | 369 | 48.93 |
| 154 | 1030 | 778 | 755 | 13 | -21.56 | -.09 | -23 | -3.09 |
| 155 | 1030 | 320 | 757 | 13 | -18.14 | 2.52 | 438 | 57.77 |
| 156 | 1031 | 67 | 758 | 13 | -14.69 | 5.22 | 691 | 91.15 |
| 157 | 1031 | 61 | 760 | 13 | -11.25 | 7.80 | 699 | 91.96 |
| 158 | 1032 | 50 | 760 | 13 | -7.75 | 10.43 | 701 | 92.16 |
| 159 | 1032 | 354 | 75! | 13 | -4.30 | 13.00 | 408 | 53.55 |
| 160 | 1033 | 207 | 762 | 13 | -.75 | 15.57 | 555 | 72.83 |
| 161 | 1033 | 320 | 763 | 13 | 2.71 | 18.11 | 443 | 58.03 |
| 162 | 1034 | 211 | 763 | 13 | 6.31 | 20.62 | 552 | 72.31 |
| 163 | 1037 | 774 | 758 | 18 | -24.40 | 4.96 | -17 | -2.18 |
| !64 | 1037 | 774 | 758 | 18 | -20.87 | 7.41 | -16 | -2.08 |
| 165 | 1038 | 312 | 759 | 18 | -17.28 | 9.98 | 447 | 58.91 |
| 166 | 1038 | 74 | 760 | 18 | -13.73 | 12.41 | 687 | 90.33 |
| 167 | 1039 | 82 | 742 | 18 | -10.09 | 14.91 | 681 | 89.27 |
| 168 | 1039 | 61 | 764 | 18 | -6.53 | 17.32 | 702 | 92.00 |
| 169 | 1040 | 109 | 765 | 18 | -2.84 | 19.75 | 656 | 85.75 |
| 170 | 1040 | 80 | 765 | 18 | .73 | 22.13 | 685 | 89.55 |
| 171 | 1041 | 323 | 765 | 18 | 4.47 | 24.49 | 442 | 57.76 |
| 172 | 1043 | 730 | 763 | 24 | -27.42 | 10.94 | -17 | -2.18 |
| 173 | 1044 | 777 | 763 | 24 | -23.72 | 13.42 | -14 | -1.80 |
| 174 | 1044 | 326 | 765 | 24 | -20.08 | 15.71 | 439 | 57.38 |
| 175 | 1045 | 79 | 766 | 24 | -16.32 | 18.1! | 637 | 89.71 |
| 176 | 1045 | 76 | 746 | 24 | -12.67 | 20.38 | 690 | 90.04 |
| 177 | 1046 | 64 | 769 | 24 | -3.87 | 22.71 | 705 | 91.74 |
| !78 | 1045 | 112 | 771 | 24 | -5.20 | 24.96 | 659 | 85.47 |
| 179 | 1047 | 312 | 772 | 24 | -1.36 | 27.21 | 59.64 | |
| ISO | 1047 | 784 | 773 | 24 | 2.32 | 29,44 | -12 | -1.49 |
| 1S1 | 1050 | 789 | 775 | 30 | -29.89 | 17.39 | -13 | -1.70 |
| 182 | 1050 | 792 | 776 | 30 | -26.16 | 19.54 | -16 | -2.02 |
| 183 | 1051 | 444 | 777 | 30 | -22.19 | 21.64 | 333 | 42.84 |
| 184 | 1051 | 86 | 778 | 30 | -18.55 | 23.96 | 693 | 68.98 |
| 185 | 1052 | 75 | 779 | 30 | -14.64 | 26.19 | 704 | 90.42 |
| 186 | 1052 | 74 | 780 | 30 | -10.38 | 28.29 | 706 | 90.56 |
| 187 | 1053 | 243 | 782 | 30 | -6.92 | 30.43 | 540 | 68.99 |
| !S8 | 1053 | 664 | 784 | 30 | -3.16 | 32.50 | 120 | 15.27 |
| 139 | 1054 | 812 | 785 | 30 | .85 | 34.57 | -27 | -3.47 |
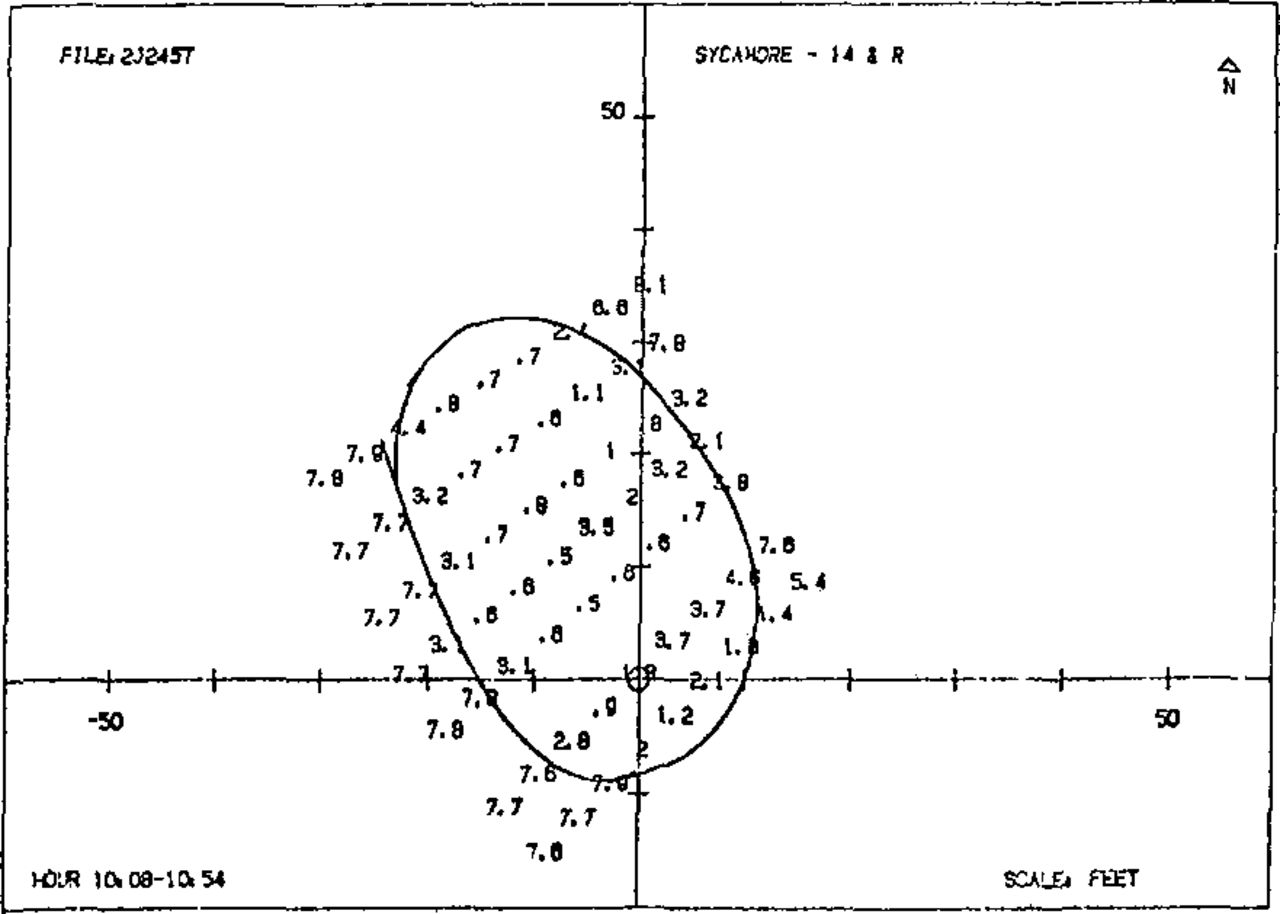
This Is a typical one hour recording of data from 10:08 to 10:54 In September. SR#1 is the sensor reading in the shade of the canopy and SR#2 is the full-sun reading in immediate area. The run distance is the track position from the tree trunk. ‘X’ and ‘Y’ are calculated coordinates for plotting purposes and Z1 is the unit difference between the two readings in watts per square meter and Z2 is the percentage difference. Negative differences are due to local reflections and will be minimized after calibration constants are applied to the data.
Figure 4 shows this tree to block 40-50% of the solar radiation in the bare branch winter condition and in the full leaf condition block an almost uniform 90%. It is interesting to note that this is very close to the expected diffuse component (vs. direct) of total solar radiation. Figure 5 shows this information for the full leaf condition.


Preliminary analysis of the other monitored trees show a typical 90% blockage during the summer months and a winter blockage ranging from 25 to 60%. A statistical analysis including curve fitting will be performed on the data to derive a model by which this information can be applied to other locations.
Footnotes
↵1 Presented at the Trees for Nebraska Conference in 1982.
- © 1983, International Society of Arboriculture. All rights reserved.
In this issue


Jump to section
Related Articles
Cited By...
- No citing articles found.