
Summer month temperatures in urban areas in the sunbelt can reach levels that approach human tolerance limits. On unshaded asphalt surfaces, temperatures as high as 111 °F (44°C) degrees have been reported (Landsberg, 1970). Our own observations support this statement for we have measured surface temperatures in excess of 130°F on unshaded parking lots. Such areas are heat sinks and are of interest to persons studying trees in an urban environment. This paper describes a preliminary study to devise instruments to measure the temperatures under and adjacent to trees in several urban settings.
Although well watered trees can remove as much sensible heat as five room air conditioners (Federer, 1976), lateral air movements tend to disperse this effect at the microscale. However, if a considerable number of trees are present, the cumulative effect is noticeable. Kratzer (1956), as cited by Federer (1976), found that temperature variations were moderated by the presence of shade trees along an avenue in a European city. Landsberg (1956) reported similar results in Washington D.C., although his shaded sites were probably as much influenced by topogrpahy and understory vegetation as they were by shade. These studies suggest that quantitative data on the effect of trees on temperatures of a microsite may aid in the siting of trees to ameloriate temperatures, as well as to define the temperatures trees must endure to exist in urban settings.
Materials and Methods
The equipment setup included four stands for holding temperature sensors that were located at heights of 2, 1, 0.5, 0.25 and 0.125 meters above ground level. A sixth detector was located at ground level near each of the stands in the experiments involving grassy surfaces (Fig. 1). One of the stands was positioned under the windward edge of the canopy. A second stand was placed near the trunk of the tree under study. A third stand was located under the leeward edge of the canopy, while the fourth was placed 2 meters to leeward of the canopy edge. Thus, the sensors on the first stand sensed the air temperature unaffected by the tree and they served to provide a control temperature. Sensors on the second, third and fourth stands detected the temperature of the air as it moved under and beyond the canopy (Fig. 2). Live oaks of approximately the same size were used at each test site for temperature detection.

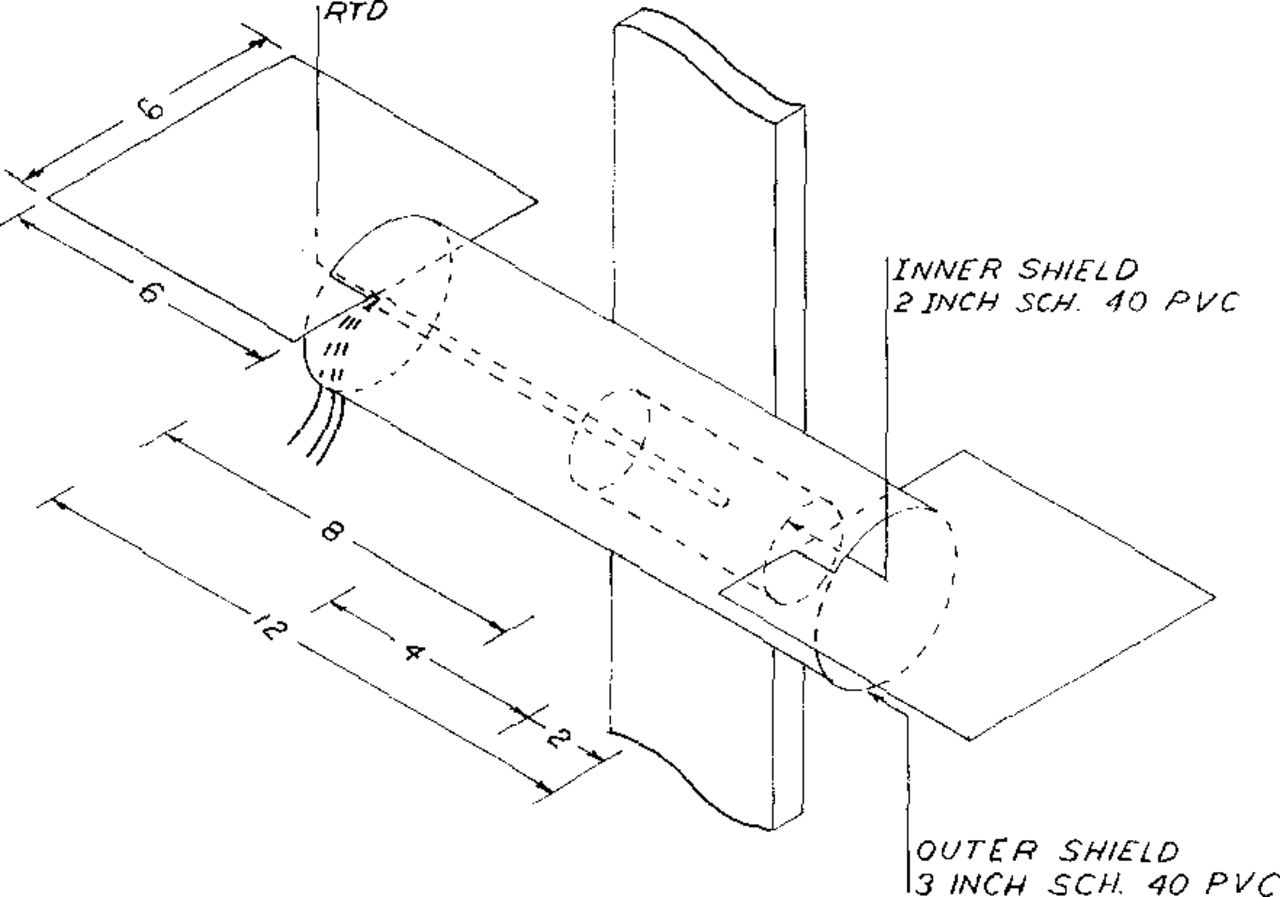
Resistance temperature detector with shields Dimension in inches.

Experimental Setup
An arbitrary precision goal was set at 0.5°F The sensors selected were platinum element resistance temperature detectors (RTD’s), with stainless steel sheaths and three lead wires for lead resistance compensation. A 24-point recorder with an RTD range card of 50 to 150°F was used in conjunction with the RTD’s. The RTD’s with lead wires were connected to the recorder and the RTD’s placed in a 75°F water bath to determine calibration terms required to bring the RTD’s into agreement within the resolution limit of the recorder, namely 0.1 °F.
It was necessary to shield the RTD’s from radiant heat sources, most notably the sun, to minimize the effects of this type of heat source on the RTD’s. Heat balance calculations indicated that a double shield consisting of two concentric tubes of PVC pipe would keep the error below the required 0.5°F even under the most extreme conditions of high radiant flux and low wind velocity. Sheet metal shades were added to the ends of the exterior tube to prevent entry of anysolar radiation to the interior of the tube shields (Fig. 3).
Resistance temperature detector stand.
Another area of concern was that minor temperature fluctuations would obscure the longer term averages of interest. To minimize this effect, the RTD’s were connected to the recorder so that all temperatures at a given level were recorded before moving to the next level. The time between recording the first and fourth stands of a given level was about 30 seconds. Transient heat transfer analysis indicated that, assuming solid stainless steel construction, a 2°F stepwise temperature fluctuation would cause a 0.3°F change in the temperature RTD during this time. The aluminum oxide insulating material would further depress the response of the RTD keeping the error caused by such fluctuations well below the 0.5°F limit established as the criterion for error in temperature detection.
System Testing
Two approaches were used to analyze the data. For the first, temperatures at a given height for each stand were compared with that of the first stand. In the second, a base temperature consisting of the medium temperature for the first stand was calculated and used for comparison. The statistical analyses were made on these temperature differences (TD) rather than on the actual temperature in an attempt to account for the differences in temperatures occurring on the day each site was measured. Cloudless days were chosen. Relative increases or decreases in temperature were used as dependent variables. These were then analyzed in respect to changes within a stand (height), changes at a height position among stands, and time (Table 1).
Examples of the derivation of values for statistical analysis for vertical level 2 (0.25 meters), asphalt site, at 3:30 PM on August 6, 1979.
A statistical analysis was made using these temperature differences and analyzing the variation between position, heights, time of day and, in the parking lot and grass area, different days. Time was treated as a covariate in both approaches of analysis. Both methods of analysis yielded similar results. Table 2 shows the statistical analysis of the basal temperature approach.
Levels of significance between measured variables for temperature differences detected at three sites
As can be seen by these results, significant differences exist for levels (heights and position) and most interactions. We are redesigning our stands to reduce the number of sensors per stand which allows us to increase the number of stands and will continue to account for time variations through analysis of covariation. Differences existed among heights on the same stand and were attributable to differences in convection heat transfer between the air and ground surfaces. The hot surfaces acted as a heat source and the cooler shaded surfaces as heat sinks. The new design will use four levels including a surface measurement because, although differences were recorded, they occurred among surface, near surface, mid height and full height. When air velocity and direction were light and variable, problems existed attributable to stand location. To alleviate this, we are using more stands and placing them at cardinal directions in an attempt to assure measurement of entering or existing air. Air velocity and direction will continue to be monitored.
Preliminary Tests
The data obtained during the equipment tests are valid and provide us with some preliminary information. Table 2 is presented to show the information attainable from such equipment. The location, both in height and stand position, of the RTD had a significant affect on the temperature recorded, in most cases, as did time of day. Throughout the tests the greatest magnitudes in temperature differences, when compared to the mean temperature of the entering air, occurred at the asphalt and parking island sites. There were greater temperature fluctuations over the asphalt surfaces than there were over the grass. Differences between days on the replicated sites can be explained by different daily variations of solar radiation, temperature, and equipment set ups.
At the asphalt locations the average temperature difference (TD) was greater on the summer dates (July 23 and 30) than on September 7. Base temperatures were also greater on these summer dates. Perhaps trees are more effective at temperature reduction when temperatures are higher. When mean temperatures of the height and position factor combinations are considered, the highest TD’s are on the peripheral stands at 0.125m and 1 m. The location of the sensors on the modified stands will include these heights and more stands will be placed on the periphery of the shaded area.
The grass site data did not exhibit the large fluctuations of the other sites. There were decreases across the crown shade ranging from three to five degrees at the 0.125 meter level. Temperatures at the two meter level varied less than one degree suggesting air mixing under the canopy. The effect of tree shade on the grass site is more pronounced nearer the grassy surface.
Examples of mean temperature differences from the basal temperature at selected vertical levels and sites.
The parking island data are perhaps the most interesting because they demonstrated the interface between asphalt and a shaded grassy surface. Larger temperature differences occurred at this site as air moved from the stand located on the asphalt to those located on the grass and shaded by the tree, even though they were measured on a cooler day than those days the other sites were recorded.
Conclusions
The intent of the equipment layout was to orient the stands along the direction of the prevailing wind. However, as we discussed, the wind was variable with breezes generally less than ten miles per hour. In future studies we plan to arrange the stands in a grid pattern to attempt quantification of the wind effect. In addition, we will reduce the number of RTD units per stand and increase the number of stands. Ground temperatures will also be measured.
As a consequence of the equipment trials, we recorded the effects of tree shade on three surfaces; grass, asphalt and a combination of the two. Preliminary results show greater ambient temperature amelioration at the grassy site and a dramatic effect of the grass and tree islands in asphalt parking lots.
Footnotes
↵1 Respectively, Professor & Head, Graduate Student and Research Associate Publication #TA 16284, Texas Agricultural Experiment Station
- © 1981, International Society of Arboriculture. All rights reserved.
In this issue


Jump to section
Related Articles
Cited By...
- No citing articles found.