
Abstract
Freely available ecosystem service models, like those incorporated in the i-Tree suite of tools, have helped scientists and practitioners estimate the environmental functions and economic benefits associated with their urban forest. Traditionally, professional inventory crews have been used to collect the inventory data needed for these models, but several cities have established crowdsourcing platforms to allow volunteers to map and inventory trees. Students in this study hosted and participated in an Arbor Day inventory collection event, using a newly released crowdsourcing application for mapping trees and estimating ecosystem services. The students located, identified, and measured trees on the University of South Florida campus (Tampa, Florida, U.S.) after a brief training session. After the one-day event, a more rigorously-trained field crew attempted to relocate the inventoried trees to assess the accuracy and variability of the data collected. Of the 339 trees inventoried at the original event, only 57.8% (n = 196) had coordinates that were accurate enough to re-measure. Of the 196 re-measured trees, 91.3% (n = 179) were correctly identified. However, only 47.9% (n = 91) of trees had dbh measurements within a one inch (2.5 cm) threshold for accuracy. Results of this experiment offer insights for communities looking to host special inventorying events to increase participation in crowdsourcing tree inventory initiatives.
- Citizen Science
- Crowdsourced Data
- Data Accuracy
- Data Quality
- Ecosystem Services
- Florida
- Tree Inventory
- Urban Forestry
Citizen scientist crowdsourcing events have evolved as a viable method for conducting ecological surveys (Kosmala et al. 2016; Ratnieks et al. 2016). These events allow trained volunteers, or even the general public, to participate in the scientific process where they collect and archive data that can be used to answer questions the participants feel are important or interesting. With the proliferation of smartphones and alternative communication devices, many data-collection initiatives have benefited from the use of mobile or internet-based applications, such as Noise Tube, an intiative that crowdsources audio from urban communities to document noise pollution (Noise Tube 2018). Once submitted, data entered via these applications are uploaded to a project database. Often, some or all of the data are open-access, empowering communities to ask their research questions or otherwise draw on data for their management and education efforts, as with Globe at Night, an international campaign used to center public awareness around light pollution (Globe at Night 2015).
Citizen science can be used to monitor abiotic (i.e., sound, lumens, water) and biotic (i.e., flora, fauna) components of ecological systems, promote environmental stewardship, and influence government agencies (Roelfsema et al. 2016). While citizen science has received greater attention in recent years, it is not an altogether new practice. In 1900, Frank Chapman, an ornithological pioneer, developed a crowdsourcing event named the Christmas Bird Count, which was later managed by the National Audubon Society (Dickinson et al. 2010). Chapman’s study evolved into a large-scale atlas that paved the way for contemporary citizen science projects and stands, historically, as the oldest, most widespread civic engagement inventory (Tulloch et al. 2013). Today, volunteer-derived data have been used to study and manage a broad range of plant and animal taxa (Kosmala et al. 2016). In urban forestry, volunteers have been used to inventory street trees (Bloniarz and Ryan 1996; Cowett and Bassuk 2012), scout for diseases (Nannini et al. 1998), and generate the data needed to run i-Tree ecosystem analyses (Casey Trees 2017; Morgenroth and Östberg 2017).
Despite the potential educational and economic advantages of working with volunteer data collectors, citizen science poses several challenges. Data quality is a fundamental concern in large-scale citizen-science events (Weigelhofer and Pölz et al. 2016). This noted, data sets produced by volunteer citizen scientists can be on par with data collected by professionals with regard to both quality and biases (Kosmala et al. 2016). If identified, biases and errors in volunteer-derived data can be mitigated statistically or by further assessing the skills or knowledge required for data collection (Kosmala et al. 2016). Some find quality data solutions through the use of registered participants and continuous training programs (Weigelhofer and Pölz et al. 2016). However, this approach requires more effort from volunteers, and it may be difficult to sustain in the long-term.
In contrast, one-day data collection events can harness volunteers’ initial interest in a project while avoiding the potential fatigue associated with sustained monitoring. Given the truncated measurement period, the training associated with a one-day data collection event is generally scaled down. Researchers speculate that the volunteers engaging in civic science projects require a detailed training session(s), to accurately obtain quality data (Ratnieks et al. 2016). What constitutes a detailed training session is unclear. Beyond reduced training, one-day data collection events (unless repeated periodically) can limit opportunities for participants to gain experience with the methods employed. Once first-time volunteers have gained proficiency in the measurements and data collection methods, the event is over.
While one can debate the benefits and drawbacks of citizen-science-derived data, the use of volunteers may ultimately prove to be the most (or only) feasible means for underfunded natural resource agencies and urban forest programs to implement on-the-ground monitoring. Mobile urban forest inventorying applications are available to facilitate tree mapping and data collection (Romolini et al. 2012). Like other mobile applications, these programs are designed to be intuitive and can be linked to internal and online references to assist users in making measurements and proper identifications. In this study, researchers reviewed records from a one-day student-inventorying event on a college campus. The student-led event was part of a seasonal day of service (Arbor Day) and was intended to highlight the recent release of TampaTreeMap, a local adaptation of an open source tree data collection and mapping program (OpenTreeMap, Azavea, Philadelphia, Pennsylvania, U.S.).
Data collected as part of this one-day event were extracted from the online database and verified by a more rigorously trained quality control team for accuracy with regard to tree location, species, and measurements. This observational study investigates whether citizen scientists can conduct accurate measurements, after minimal instruction, when assisted by a mobile mapping application designed to facilitate crowdsourcing. While past works have documented the success of longer term inventorying programs (where teams of volunteers work for days or weeks), this inventory event was limited to a single day. Additionally, most assessments of volunteer-derived data were conducted in temperate North America. This study was conducted in a subtropical climate, providing a different range of species and species-related measurement challenges than have been previously documented.
Moreover, many past studies have been conducted on street trees with more clearly defined planting spaces (e.g., tree lawns/terraces). The inventorying event documented here was conducted in a park-like, campus environment, which necessitated a GPS- or reference-object-based location system. Ultimately, this work investigates a real-world inventory effort, offering insights into the value and limitations of one-day data collection events and crowdsourcing technology designed to help populate urban forest inventory databases.
METHODS
On 17 January 2015 (Arbor Day in Florida, U.S.), a one-day volunteer tree inventory event was held at the University of South Florida campus in Tampa, Florida, U.S. (28.0587°N, 82.4139°W). Before the event, organizers divided the campus into 20 measurement areas to prevent data collection overlap. Within these measurement areas, groups of Arbor Day volunteers (total n = 60, volunteers) were instructed to conduct an inventory of trees for two hours. Participants were undergraduate college students. They did not receive academic credit or any similar compensation for their time.
The groups used an iOS data collection and tree mapping application (OpenTreeMap, Azavea, Philadelphia, Pennsylvania, U.S.) and a diameter tape to collect data. Prior to being sent to their respective measurement areas, participants watched a brief PowerPoint® training session (i.e., 23 slides, or approximately 30 minutes) that provided instructions on how to measure and plot trees using the inventorying application and tape provided. The presentation also showed eight of the most common tree species on campus and their defining characteristics. Later, in small groups, the Arbor Day inventory event organizers verified each student volunteer’s individual ability to identify species and measure trees (e.g., dbh). During this session, the organizers showed participants how to locate and record a tree’s geographic location using an integrated aerial map function, enter measurement data, and include a photograph of the sample specimen.
After the training, the groups were given a campus map showing their assigned measurement area zones. Participants utilizing the diameter tape were instructed to measure the diameter of mature trees at 1.37 m from the tree base. After two hours of participation, the student volunteers returned to a nearby lecture hall to complete a survey of their experience. These evaluations used a standardized, 19-question questionnaire developed by the university to assess student programs. Questions were a 5-point rating or yes/no depending on the question asked. The evaluations were assessed using descriptive statistics in Excel™.
During the summer, a more rigorously-trained quality control team with three advanced (senior bachelor’s degree) environmental science students accessed the records online and revisited the inventoried trees to recheck the locations, species identification, measured trunk diameters, and estimated heights. In addition to the tools and resources provided to volunteers, the quality control team was equipped with a range finding hypsometer (Forestry Pro Laser Rangefinder model 8381, Nikon Corporation, Tokyo, Japan; height data not reported) and a regional field guide not available at the time of the original inventorying event (Koeser et al. 2015). In reassessing the inventoried data, the quality control team noted any trees they could not find given the coordinates logged, trees with incorrectly identified species, and trees with trunk diameters above or below a 2.54 cm error threshold. When significant differences were noted, the records were updated to reflect correct identifications and measurements made by the quality control team. Pictures were taken of any trees requiring additional aid for identification (provided by faculty supervisors).
All data used in this study were downloaded directly from TampaTreeMap.org. Program evaluations were provided to the authors by the event planners. As such, the research team received an existing data exemption through the supervising author’s internal review board.
RESULTS AND DISCUSSION
Of the 339 trees logged at the Arbor Day inventorying event, only 196 were found by the quality control team, resulting in a re-location success rate of 57.8%. In looking at the response data from the post-event survey, many participants expressed that they had difficulties attempting to map trees using the aerial image function. At the time, some respondents attributed this to a potential but unconfirmed glitch with the application used (a locally modified version of Open-TreeMap), in which multiple users appeared to be blocked from making simultaneous data submissions. Even when working seamlessly, the mapping function requires some correction from the user (GPS is used to provide a rough location, but the user drops a “pin” on the tree being inventoried, given their interpretation of aerial images). Aerial interpretation can take some skill, depending on the site and tree coverages. This knowledge requirement may have served as another layer of variation, limiting coordinate accuracy. As a comparison, Crall et al. (2011) noted 85% of citizen scientists accurately recorded the coordinates of invasive plants during a mapping event that included a one-day training program, even though 69% of their volunteers had little or no experience using GPS units. Regardless of the underlying cause, many trees mapped by the Arbor Day student volunteers were not found. Others had unclear coordinates, which made it difficult to identify individuals from one another when planted in groups. Without accurate coordinates, relocation proved difficult within the 7.8 km university campus. Relocation success rates for street trees using an address-based plot identification system would surely be higher. In a four-city study of volunteer street tree data, Roman et al. (2017) had little difficulty relocating trees inventoried by their volunteers. Overall, there was approximately 99% agreement between the original and re-inventory data sets with regard to tree location (Roman et al. 2017).
Of the trees successfully relocated by the quality control team, all but 17 (8.7 %) were properly identified to the species level by the Arbor Day student volunteers. The observed species identification success rate of 91.3% was similar to what Roman et al. (2017) observed at their Philadelphia (U.S., 89.9%) and Malmo (Sweden, 95.5%) sites for their novice participants (the closest comparison with regard to skill level).
Trunk diameter at breast height measurements for the re-inventoried trees ranged from 9.6 to 109.5 cm. The average diameter was 40.0 cm, with a standard deviation of 24.5 cm. The mean difference between the volunteer-derived diameter data and the quality control team-derived data was 2.83 cm. The median and mode differences were both 0. Of the 196 trees relocated, 94 (47.9%) had diameter differences less than 2.54 cm. Going beyond this original threshold, 123 (62.8%) of the trees were originally measured within 5.08 cm of the dbh measured by the quality control team. A total of 138 (70.4%) trees were measured within 7.62 cm of the dbh measured by the quality control team. For perspective, the Florida Forest Service audits every inventory project they fund through their matching urban and community grant program. When in conversation with several foresters who have conducted these data quality assessments, differences of 7.62 cm or less would not raise concern (multiple sources, personal communication).
Compared to the work by Roman et al. (2017), which featured more rigorously trained volunteers, the trunk diameter data collected by volunteers in the current study differed to a greater degree when compared to the quality control group (Figure 1). Roman et al. (2017) found volunteer-derived diameter data differed with their expert group by only 0.33 cm. Species differences may account for some of this difference. For example, Sabal palmetto (cabbage palm) can often have large boots (i.e., the cut ends of pruned fronds) on their trunks. How a diameter tape lays across these could potentially impact the measured stem diameter (Figure 1).

Four most commonly measured taxon during the Arbor Day event. The median difference of dbh measurements is depicted with a solid black horizontal bar. The differences in dbh were compared against the measurements from the professionally trained scientists (quality control team). The violin plots show the distribution of dbh differences measured by the citizen scientists. The circles in the graph illustrate raw data points (dbh measurements).
Another explanation for this discrepancy is the nature of the two inventories. The quality control team of the current study had to rely on GPS coordinates derived from consumer-grade mobile devices and novice interpretation of aerial photos in relocating trees. Instances where Quercus virginiana (live oak) and Quercus laurifolia (laurel oak) differ significantly are likely cases where a different tree was re-inventoried, provided there was imprecise location information. These two species are among the most common shade trees found in Tampa, Florida (Koeser et al. 2016), and they appear in groups on the USF campus. Given this, citizen science inventory efforts may be best suited for street tree populations, where location is defined by a physical address.
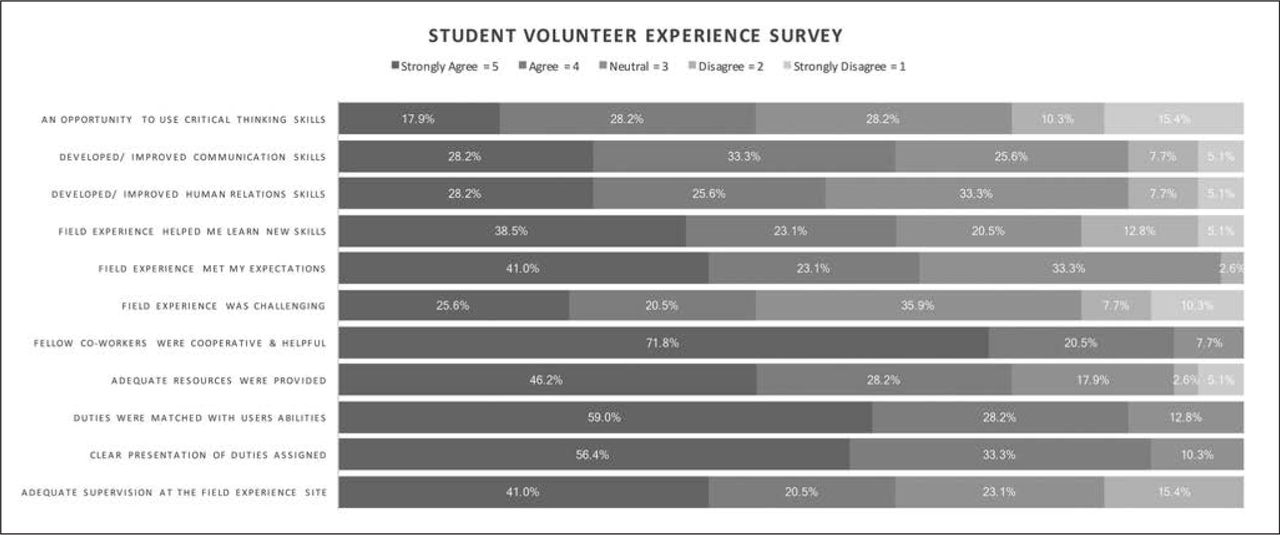
After analyzing the post-event surveys completed by the participants, researchers found that 69% of the student volunteers felt the inventory event was a positive experience. Additionally, 61.6% of the students reported that their involvement with the Arbor Day experience allowed them to acquire new skills related to arboriculture (Figure 2). A majority of the participants rated their coworkers as cooperative (92.3%; Figure 2), and many of the participants (92%) suggested and agreed that they would recommend the experience to other students.

Participant survey responses regarding the value of the experience as a student volunteer. Student volunteers (n = 46) noted their agreement to a series of statements using a scale that ranged from 1 (Not at All) to 5 (Completely).
CONCLUSION
While somewhat more challenging due to limitations in participant training and time spent honing inventorying skills, one-day inventory events may be a viable option for cities and institutions looking to increase the number of trees entered in their management systems. For trees successfully relocated, the diameter measurements made by student volunteers were acceptable, and species identification success rates were on par with those published in past studies. The most pressing concern noted in the current study was the inability of the quality control group to relocate trees. With fewer reference points and higher stocking densities, open areas like parks and campuses are more challenging than streets to inventory and re-inventory. This was observed in the relatively low relocation success rate. Campuses and cities looking to replicate these efforts with the same mobile application should focus their training efforts on georeferencing trees with the mapping function, if they hope to relocate and update trees in the future. Given the nature of the tree mapping function, a brief overview of aerial interpretation may be useful, especially when trees are located in groups or in areas lacking easily identifiable landmarks.
- © 2018, International Society of Arboriculture. All rights reserved.


Jump to section
Related Articles
Cited By...
- No citing articles found.