
Abstract
Trees provide ecosystem services that benefit humans and the environment. Unfortunately, urban trees often do not provide maximum services due to abiotic stress and arthropod herbivores and borers. These problems often originate from trees being planted in unsuitable conditions. Cities are warmer than natural areas because impervious surfaces absorb and reradiate heat. Higher temperatures can increase pest insect abundance and water stress, and reduce street tree condition relative to natural forests. For example, the gloomy scale insect [Melanaspis tenebricosa Comstock (Hemiptera: Diaspididae)], a pest of red maple (Acer rubrum) street trees, is more abundant in warmer than cooler urban sites. Acer rubrum, at warmer urban sites with more M. tenebricosa, are typically in poor condition. Here, researchers demonstrate these relationships and illustrate how impervious surface cover can be used to predict the condition of A. rubrum street trees. Impervious surface thresholds were then developed to define suitable planting sites that can be used by individuals with access to GIS software. Researchers present the ‘Pace-to-Plant’ technique, which can be used by landscape professionals to quickly estimate impervious surface cover around a planting site. These thresholds predict future tree condition based on planting site impervious surface cover. The hope is that more informed planting will minimize pest infestations and maximize the future vigor and performance of street trees.
- Acer rubrum
- Gloomy Scale
- Impervious Surface
- Integrated Pest Management
- Melanaspis tenebricosa
- Red Maple
- Street Tree
- Urban Forestry
Trees provide services such as carbon sequestration, temperature reduction, and air and water filtration, which benefit people and the environment (Oke et al. 1989; Tzoulas et al. 2007; Donovan et al. 2013; Nowak et al. 2013). These services are even more important within cities because over half of the world’s population, and 80% of the U.S. population, inhabit them (Alig et al. 2004; WHO 2014). Maximizing these services in urban forests is challenging because urban habitats are dynamic and stressful. For example, it has been documented for over a century that herbivores are more abundant and damaging in cities than in surrounding natural habitats (Putnam 1880; Metcalf 1912; Tooker and Hanks 2000; Raupp et al. 2010). The first step in urban landscape integrated pest management (IPM) is planting the appropriate tree species for the conditions at specific urban sites (Raupp et al. 1985; Raupp et al. 1992). Unsuitable urban conditions can increase tree stress and pest abundance, limiting the ecosystem services trees provide (Coffelt et al. 1993; Vilagrosa et al. 2003; Nowak et al. 2004; Litvak et al. 2012; Boyd et al. 2013; Savi et al. 2014).
Impervious surfaces are those that are impenetrable to water, such as asphalt, concrete, and brick. These surfaces create roads, parking lots, and buildings, which absorb sunlight and release it as heat, creating what is called the urban heat island effect (Oke 1973; Kim 1992; Nowak and Dwyer 2000). Impervious surface cover around a planting site can stress plants by limiting root growth, raising temperatures, and creating drought-like conditions (Oke et al. 1989; Nowak et al. 1990; Graves 1994; Leibowitz 2012; Savi et al. 2014). Herbivorous arthropod pests can benefit from the resulting plant stress and from warming (White 1984; Herms and Mattson 1992; Huberty and Denno 2004; Raupp et al. 2010; Meineke et al. 2013; Dale and Frank 2014b, Youngsteadt et al. 2014). For example, abundance of mimosa webworm (Homadaula anisocentra) and horsechestnut scale (Pulvinaria regalis) on urban trees increased with the amount of impervious surface surrounding a tree (Speight et al. 1998; Sperry et al. 2001). Dale and Frank (2014b) found a similar pattern with a scale insect pest, Melanaspis tenebricosa, but determined that temperature, rather than impervious surface itself, was the primary factor driving pest abundance. Herbivorous arthropods, particularly sap-feeding insects, can reduce woody plant photosynthesis, growth, and reproduction, so preventing infestations or reducing pest abundance is important for sustaining urban tree health (Zvereva et al. 2010).
Scale insects are among the most damaging and difficult to manage arthropod pests of landscape plants (Adkins et al. 2010; Raupp et al. 2010). In the southeastern U.S., Melanaspis tenebricosa (Comstock) (Hemiptera: Diaspididae) is the most important pest of red maple (Acer rubrum) street trees (Metcalf 1912; Frank et al. 2013). Melanaspis tenebricosa is a native, univoltine (one generation per year), armored scale insect that lives on the bark and feeds on vascular fluids of trees, primarily Acer spp. (Metcalf 1922). This host plant association is important because Acer is the most commonly planted genus of street tree in the eastern U.S., including North Carolina (Raupp et al. 2006). Melanaspis tenebricosa are drastically more abundant in urban than natural forests (Metcalf 1912; Youngsteadt et al. 2014), and are up to 200 times more abundant at warmer than cooler urban sites due to greater body size, reproduction, and population growth (Dale and Frank 2014b). High M. tenebricosa abundance on A. rubrum street trees causes branch dieback, canopy thinning, premature leaf drop, and bark discoloration, which may reduce the services these trees provide (Dale and Frank 2014a; Savi et al. 2014).
Researchers examined the relationship between impervious surface cover, temperature, scale insect abundance, and tree condition, with the goal of using impervious surface cover to predict tree condition and select appropriate planting sites. Here, the objectives are to 1) document the relationship between impervious surface and A. rubrum condition, 2) develop impervious surface thresholds that landscape architects can use when specifying A. rubrum on landscape plans, and 3) develop a technique that landscape professionals can use on site to make informed decisions. Historically, thresholds have been used in IPM to effectively manage pests, however, few are established for urban landscapes (Raupp et al. 1988; Coffelt and Schultz 1990; Raupp et al. 1992; Coffelt and Schultz 1993). The IPM decision-making tools presented here will help planners and urban forest managers get the right tree in the right place to reduce future maintenance costs and increase tree survival and services.
MATERIALS AND METHODS
Study System and Design
A study was conducted in Raleigh, North Carolina, U.S., from 2012 through 2014. The study sites were selected using a Geographic Information System (GIS)–based street tree inventory created by the Raleigh Parks, Recreation, and Cultural Resources department. Acer rubrum street trees from this inventory were overlaid onto a Landsat thermal image of surface temperatures in Raleigh, acquired on 18 August 2007, and prepared as described in Meineke et al. (2013). Two subsamples of A. rubrum street trees were selected from the inventory and pooled for analyses (Figure 1a). Fifty-eight trees were selected in 2012 by dividing Raleigh into 4 km2 sections and randomly selecting A. rubrum from the hottest and coldest regions of each section as described in Youngsteadt et al. (2014). Twenty-four additional A. rubrum were randomly selected in 2014 using the same method as Youngsteadt et al. (2014). All trees were between 15.2 and 50.8 cm in diameter at breast height (DBH).

a) Thermal map of surface temperatures in Raleigh, North Carolina, U.S., taken on 18 August 2007. Each point represents a randomly selected A. rubrum street tree (N = 82). b) Zoomed in image of a single street tree placed onto a map of surface temperatures and impervious surface ground cover classification. Each ring around the tree represents one of the 13 radii for which percent impervious surface was calculated.
Field Measurements
Landsat thermal images provide only a snapshot of surface temperatures useful for site selection. To monitor ambient air temperatures experienced by trees during the study, iButton® Thermochron® DS1921G (Dallas Semiconductor, Dallas, Texas, U.S.) remote temperature loggers were placed within 59 ml portion containers (Dart Container Corporation, Mason, Michigan, U.S.) and fastened with a zip tie to the underside of a branch, approximately 4.5 m above ground within the lower third of the canopy of each tree. iButton data loggers recorded ambient temperature every one to three hours depending on the tree subsample. Because all sites have daily temperature data for August, the average August temperature was used for all analyses; 24 of the site temperatures were recorded in August 2014, while the remaining 56 were recorded in August 2013. Due to loss of iButton data loggers for unknown reasons in the field, 80 of the 82 sites were used for temperature analyses.
To determine M. tenebricosa abundance, researchers pruned one randomly selected 0.3 m terminal twig from four cardinal directions of each tree using a pole pruner as described in Dale and Frank (2014a); Dale and Frank (2014b); Youngsteadt et al. (2014). In the laboratory, twigs were examined under a dissecting microscope to count live M. tenebricosa adult females per 0.15 m of twig.
Tree condition was rated as excellent, good, fair, or poor. Condition was assigned based on leaf condition, amount of branch dieback, central leader health, and other characteristics as described in Dale and Frank (2014a) and similar to Berrang et al. (1985). The City of Raleigh assigned condition ratings to most tree species listed in the inventory as they were assessed over the previous seven years. Within the data set, which was selected from this inventory, 39 A. rubrum had condition ratings assigned to them by the City of Raleigh Urban Forestry Division, 26 were assigned condition ratings as part of a previous study in 2013, and 17 did not have condition ratings, so they were omitted (final N for condition analyses = 65) (Dale and Frank 2014a).
To determine the amount of impervious surface around each of the study trees, ArcMap (ArcGIS 10.2) was used to calculate the percent impervious surface cover within given radii of each tree. Impervious surface cover was delineated at a 1 m resolution as described in Bigsby et al. (2013), and included buildings, pavement, and asphalt (e.g., parking lots, roads, and sidewalks). Using a shapefile of the study sites (N = 82), circular buffer regions were created around each tree at 10, 15, 20, 25, 30, 35, 40, 45, 50, 60, 80, 100, and 125 m radii (Figure 1b). Researchers calculated the total area (m2) within each buffer region that contained pixels scored as impervious in the raster image. Using the total area of impervious surface, the percentage of the buffer region that was composed of impervious surface at each radius was calculated.
Statistical Analyses
Simple linear regression was used (JMP Pro 11) to determine the relationships between temperature, scale insect abundance, and impervious surface cover. Researchers log10(x+1) transformed scale counts to meet assumptions of linear regression, as determined by inspecting plots of residuals. Simple logistic regression was used (JMP Pro 11) to determine how scale insect abundance or impervious surface cover at each radius predicted tree condition. Using the probability formulas generated from the logistic regression for each radius, researchers calculated the likelihood of a given tree condition across a range of 0% to 100% imperious surface. To establish impervious surface cover thresholds, researchers calculated the average percentage of impervious surface cover for all measured radii at which the most likely condition changed from good to fair and fair to poor.
Impervious Surface Estimation
The ‘Pace-to-Plant’ technique was developed to create a tool for on-the-ground application of the results. After testing each measured radius from the tree as described previously, it was decided that a 20 m radius provided the best balance of accuracy and practicality. A 20 m radius predicts significant effects of impervious surface on tree condition rating while also being short enough for someone to walk. Using this method, one can walk 25 steps (approximately 20 m) from the planting site in four directions at 45 degrees to the longest adjacent impervious edge, and estimate the percentage of impervious surface surrounding it (Figure 2). Once each of four paths has been walked, the total number of steps onto impervious surface is divided by the total number of steps taken (100) to give an estimate of the percent of impervious surface surrounding the planting site.

Four designed landscape scenarios illustrating the ‘Pace-to-Plant’ technique. In each diagram, the tree or planting site is located at the intersection of the transects. Circle diameters are equal to 40 m and road widths are equal to 9 m. White dashes represent steps onto impervious surface and black dashes represent steps onto pervious surface. The number of white dashes equals the percent impervious surface estimate for each scenario.
To refine and test this technique, four hypothetical scenarios of urban planting sites were created (Figure 2). These scenarios do not encompass all possible site characteristics and may not conform to all urban planting regulations, but provided the necessary framework for technique development. Figure 2a, Figure 2b, Figure 2c, and Figure 2d illustrate street tree plantings in a median strip, three-way intersection, four-way intersection, and a permeable island, respectively. Each scenario was designed with 9 m road widths and a tree planted 1 m from the curb, in compliance with Raleigh, North Carolina, U.S., street design regulations (City of Raleigh 2014). With these scenarios, researchers used basic geometry to calculate the area of impervious surface within a 20 m radius of the planting site and determined the impervious percentage of that area. With an architect’s scale, 25 equidistant points were measured in four directions that were each equivalent to the 20 m radius representing a person’s steps (Figure 2). The number of points within the impervious areas were then counted and divided by 100 to determine the impervious estimate.
To further validate this method, three individuals went to 15 A. rubrum street trees and estimated impervious surface cover using the ‘Pace-to-Plant’ technique. These 15 trees were selected to maximize technique validation efficiency and capture a large range of percent surrounding impervious surface cover. Following the ‘Pace-to-Plant’ estimations, ArcMap was used to calculate the percent impervious surface around the same A. rubrum street trees at the same radius. Researchers took the mean of the three paced estimates of impervious surface cover and compared them to the GIS calculation to see how well one predicted the other.
RESULTS
Field Measurements
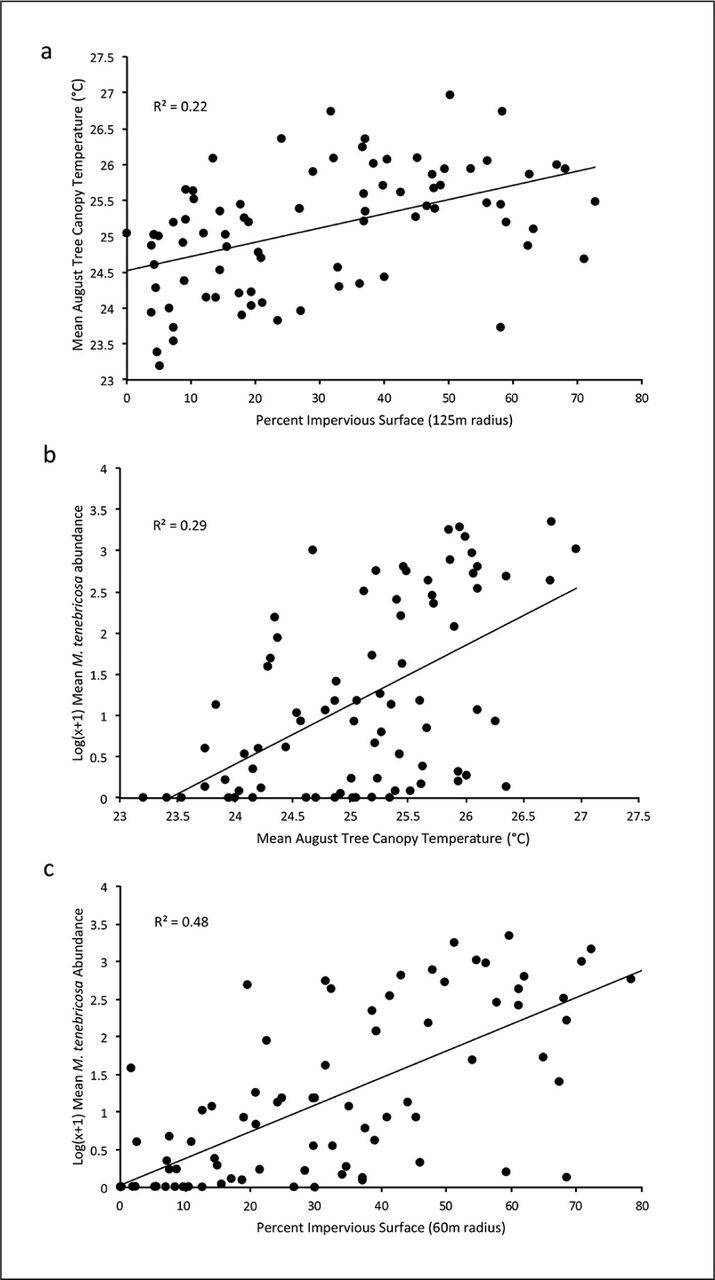
August average tree canopy temperatures ranged from 23.20°C to 26.96°C, with a mean (±SD) of 25.11 (±0.85). For all 82 study trees, M. tenebricosa abundance per 0.15 m of twig ranged from 0 to 2241 live individuals with a mean of 261.21 (±510.65). Melanaspis tenebricosa abundance increased with average August tree canopy temperature (simple linear regression, R2 = 0.29, P < 0.0001) (Figure 3b).

Simple linear regression of a) percent impervious surface (125 m radius) and tree canopy temperature, b) tree canopy temperature and M. tenebricosa abundance, and c) percent impervious surface cover (60 m radius) and M. tenebricosa abundance.
Tree condition ratings included 6 excellent, 23 good, 22 fair, and 14 poor trees. Melanaspis tenebricosa abundance significantly predicted A. rubrum street tree condition (N = 65, χ2 = 33.41, P < 0.0001). As scale insect abundance increased, the probability of finding a tree in poor condition significantly increased, while the probability of finding a tree in good condition decreased.
Percent impervious surface cover was calculated at 13 different radii for each study site. At the smallest radius (10 m), percent impervious surface ranged from 0% to 99.2%, while at the largest radius (125 m), percent impervious surface ranged from 3.8% to 72.7%. Percent impervious surface cover significantly predicted mean August tree canopy temperature at all radii (P < 0.01). Tree canopy temperature was best predicted at the 125 m radius (R2 = 0.22, P < 0.0001) (Figure 3a). For every percentage increase in impervious surface cover in the 125 m radius, tree canopy temperature increased by 0.02°C. Since M. tenebricosa abundance increased with temperature, and temperature increased with impervious surface, researchers tested the relationship between M. tenebricosa abundance and percent impervious surface. It was found that, at all radii, as percent impervious surface cover increased, mean M. tenebricosa abundance per 0.15 m of twig also increased (P < 0.01). Scale insect abundance was best predicted by percent impervious surface cover at a 60 m radius around the tree (R2 = 0.48, P < 0.0001) (Figure 3c).
Given the relationships between impervious surface cover, M. tenebricosa abundance, and A. rubrum condition, researchers used impervious surface to predict tree condition rating. At all measured radii, percent impervious surface cover significantly predicted the likelihood of finding a tree in a given condition (N = 65, P < 0.01). All condition ratings were significantly predicted from 40 to 125 m radii. Excellent, good, and poor condition ratings were significantly predicted from 15 to 35 m radii. Impervious surface cover at a 10 m radius only statistically predicts good and poor condition ratings. The best predictor of tree condition rating, based on goodness of fit indices, was at a 100 m radius from the study tree (χ2 = 29.87, P < 0.0001).
For each model (10–125 m radius), the most likely condition rating for every percentage increase in impervious surface was determined. The threshold calculations show that trees were most likely to be in good condition at sites with 0% to 32% impervious surface. Between 32% and 62% impervious surface, trees were most likely be in fair condition. At any percentage of impervious surface cover above 62%, trees were most likely be in poor condition (Figure 4).
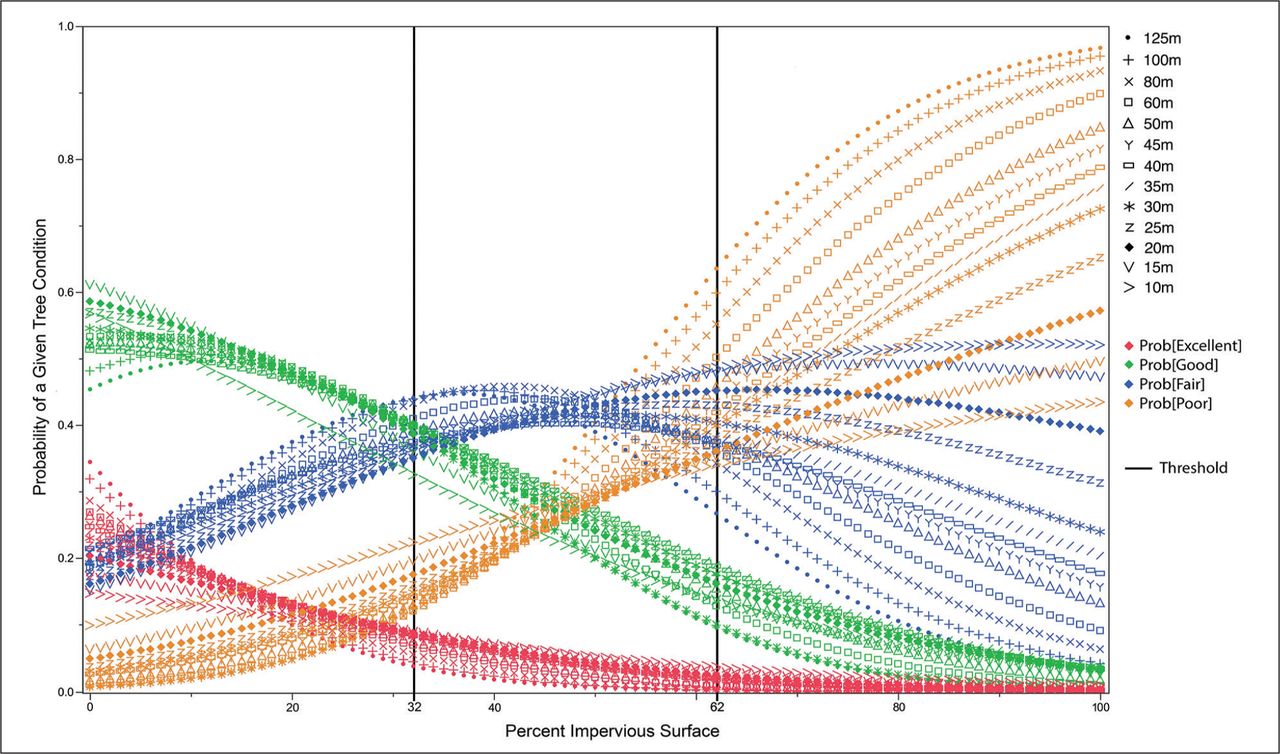
Probability curves illustrating the change in probability of finding a given tree condition rating as percent impervious surface around a planting site increases from 0% to 100%. Threshold lines are the average point at which each radius from the tree predicts a change in tree condition for all 13 measured radii. Each symbol indicates a different measured radius from the tree. Different colors represent different tree condition ratings.
Impervious Surface Estimation
Although the strongest relationship between impervious surface cover and tree condition was at a 100 m radius (χ2 = 29.87, P < 0.0001), this is too far and time consuming for people to walk around each planting site. Both 20 and 25 m radii from the tree were statistically significant predictors of tree condition (χ2 = 16.8, P = 0.0008; χ2 = 17.22, P = 0.0006) and are more practical to walk. To reduce the time and complexity of estimating impervious surface, researchers recommend measuring a 25-step radius from the planting site, which creates a 20 to 25 m radius circle around the planting site (depending on step length) and sums to 100 steps. Therefore, the number of steps on impervious surface is equal to the percent impervious surface around that planting site.
Based on calculations of four urban landscape scenarios, the simulated paced estimates were, on average, 1.6 percentage points less than the actual percent impervious surface (Figure 2). There was a strong, positive correlation between the actual and estimated percent area of impervious surface (R2 = 0.96, P = 0.0198) (Figure 5a).

a) Simulated paced estimate of impervious surface on x-axis correlated with the calculated actual percent impervious surface from four landscape scenarios. b) ‘Pace-to-Plant’ estimate of percent impervious surface cover on x-axis correlated with the GIS-calculated percent impervious surface at a 20 m radius. c) ‘Pace-to-Plant’ estimate of percent impervious surface cover on x-axis correlated with log transformed M. tenebricosa abundance.
On average, on-site validation using 25 steps overestimated impervious surface cover by 14% when compared to ArcGIS calculations. There was, however, a strong positive relationship between the two (R2 = 0.74, P < 0.0001) (Figure 5b). In addition, the paced estimates more strongly predicted M. tenebricosa abundance (R2 = 0.53, P = 0.002) than did GIS calculations at a 20 m radius (R2 = 0.29, P < 0.0001) (Figure 5c).
DISCUSSION
Urban forests face many challenges that make optimal tree vigor and longevity difficult to achieve. Impervious surface cover limits root growth and root access to water and nutrients, while also increasing temperatures (Oke et al. 1989; Graves 1994). The results of the current study indicate that greater impervious surface cover leads to warmer temperatures, greater M. tenebricosa abundance, and worse A. rubrum street tree condition. Researchers identified thresholds of impervious surface cover for landscape architects and other planners to consider when designing a landscape with A. rubrum. The ‘Pace-to-Plant’ technique provides a way for landscapers to assess sites when deciding which plant species are appropriate. These two tools should improve urban tree health and survival.
The researchers focused on the effects of impervious surface cover on temperature and its subsequent effects on scale insect abundance and tree condition. The larger data set corroborates Dale and Frank (2014a) and Youngsteadt et al. (2014) findings that M. tenebricosa abundance increases with temperature. However, percent impervious surface cover predicted M. tenebricosa abundance more strongly (R2 = 0.48) than did tree canopy temperature (R2 = 0.29) (Figure 3). This suggests that impervious surface affects trees and scale insects through more than increasing temperature, perhaps by increasing tree water or temperature stress (White 1984; Raupp et al. 2010; Savi et al. 2014). As a result, impervious surface is an even better tool than temperature for predicting A. rubrum tree condition and susceptibility to M. tenebricosa.
Percent impervious surface significantly predicted tree condition at all tested radii around the tree. It is important to note that the best model fits were at the largest radii, suggesting that impervious surface has a cumulative effect on tree condition. Therefore, when making planting decisions, one must consider ground cover at larger scales than the immediate planting site. Landscape architects have access to GIS software with which they can analyze groundcover on a landscape scale. Using these results and impervious surface thresholds, these individuals have the knowledge and tools needed to avoid specifying A. rubrum in sites with greater than 32% impervious surface.
When at a site, smaller radii are more practical to measure. Therefore, an approximate 20 m radius (or 25 steps) from the planting site is recommended. At this distance, excellent, good, and poor condition ratings can be predicted with confidence. In addition, 25 paces in four directions sums to 100, which allows for simple percent calculations. For cases where shrubs or buildings obstruct the walking pathway, one must estimate the number of steps taken up by that space. It is important to note that sites with relatively little surrounding tree canopy and other vegetation cover were more accurately estimated than those with more surrounding vegetation cover. The authors suspect this means the GIS land cover map actually underestimates impervious surface because it is an aerial image that excludes impervious cover beneath tree canopies. The ‘Pace-to-Plant’ technique more accurately estimates impervious surface cover because it accounts for groundcover beneath vegetation cover. This technique gives landscape professionals the tools to assess sites that have been specified for A. rubrum or to select A. rubrum for their own plantings. These professionals often warranty the trees they plant, and that landscape architects specify. Therefore, ensuring the success of the tree could reduce costs and improve business.
The purpose of this technique is not to create definitive limitations for A. rubrum planting sites, but to make recommendations based on the probability of the future condition of a tree planted at a given site. Another important component to consider is the amount and structure of vegetation surrounding the planting site. Vegetation structural complexity, particularly tree canopy cover, affects site temperature and subsequent pest abundance (Shrewsbury and Raupp 2000; Tooker and Hanks 2000; Dale and Frank 2014b; Frank 2014). Vegetation complexity can also promote biological control by providing habitat refuges for natural enemies, although previous research has found that temperature and impervious surface were more important in this system (Hanks and Denno 1993; Shrewsbury and Raupp 2000; Tooker and Hanks 2000; Frank and Shrewsbury 2004; Dale and Frank 2014b). Therefore, a site with more complex surrounding vegetation could buffer the effects of impervious surface.
The ‘Pace-to-Plant’ technique provides a tool that landscape professionals can use to quickly and easily assess a planting site and reduce the risk of future tree failure or decline. These data and simulations are specific to A. rubrum in the southeastern U.S. However, based on the negative effects of impervious surface on other tree species, it is likely that future research can adapt these thresholds for other tree species. Many problems with tree health originate at planting (Grabosky and Gilman 2004). One of the first steps of IPM in urban landscapes is correctly planting the appropriate tree in a given space to maximize its success and reduce future management costs (Raupp et al. 1985; Raupp et al. 1992; Grabosky and Gilman 2004). Using these impervious surface thresholds and the ‘Pace-to-Plant’ technique, landscape architects and other landscape professionals have the tools to plant the most common landscape tree in the eastern U.S. in more suitable locations.
Acknowledgments
We thank Kristi Backe and Barbara Fair for assisting with study design and analysis, and for commenting on the manuscript. We thank the City of Raleigh Parks, Recreation, and Cultural Resources department for their permission to conduct this research on city-owned trees. The project described in this publication was supported by a fellowship to AGD and Cooperative Agreement No. G11AC20471 and G13AC00405 from the United States Geological Survey. Its contents are solely the responsibility of the authors and do not necessarily represent the views of the Southeast Climate Science Center or the USGS. This manuscript is submitted for publication with the understanding that the United States Government is authorized to reproduce and distribute reprints for governmental purposes. This project was also supported by Agriculture and Food Research Initiative Competitive Grant no. 2013-02476 from the USDA National Institute of Food and Agriculture to S.D.F. and E.Y.
- Copyright © 2016, International Society of Arboriculture. All rights reserved.
LITERATURE CITED


Jump to section
Related Articles
Cited By...
- No citing articles found.