
Abstract
Tree City USA is a national program that recognizes municipal commitment to community forestry. In return for meeting program requirements, Tree City USA participants expect social, economic, and/or environmental benefits. Understanding the geographic distribution and socioeconomic characteristics of Tree City USA communities at the national scale can offer insights into the motivations or barriers to program participation, and provide context for community forestry research at finer scales. In this study, researchers assessed patterns in Tree City USA participation for all U.S. communities with more than 2,500 people according to geography, community population size, and socioeconomic characteristics, such as income, education, and race. Nationally, 23.5% of communities studied were Tree City USA participants, and this accounted for 53.9% of the total population in these communities. Tree City USA participation rates varied substantially by U.S. region, but in each region participation rates were higher in larger communities, and long-term participants tended to be larger communities than more recent enrollees. In logistic regression models, owner occupancy rates were significant negative predictors of Tree City USA participation, education and percent white population were positive predictors in many U.S. regions, and inconsistent patterns were observed for income and population age. The findings indicate that communities with smaller populations, lower education levels, and higher minority populations are underserved regionally by Tree City USA, and future efforts should identify and overcome barriers to participation in these types of communities.
- Arbor Day Foundation
- Community Forestry
- Community Size
- Geographic Region
- Green Infrastructure
- Municipal Management
- Tree City USA
Urban trees provide a wide array of environmental, social, and economic benefits (Dwyer et al. 1992; McPherson et al. 1997; Donovan and Butry 2010), such as improved stormwater management, reduced urban heat island effects, and increased property values. Most residents agree that urban trees are important and the benefits of trees outweigh the annoyances trees cause (Lohr et al. 2004; Schroeder et al. 2006). It is common for municipalities to plant and maintain trees on public land to take advantage of the benefits trees provide and to meet citizen demand for treed urban landscapes. However, community forestry programs vary widely in terms of institutional structure, tree care practices, and funding (Kuhns et al. 2005; Ries et al. 2007; Stevenson et al. 2008), which makes it difficult to gauge a municipality’s dedication to community forestry. The Tree City USA (TCUSA) program addresses this difficulty by recognizing communities that demonstrate a commitment to tree planting and care (Rosenow and Yager 2007).
In the United States, TCUSA is the primary national program certifying the proactive management of community forests. TCUSA was created in 1976 and is administered by the Arbor Day Foundation in partnership with the USDA Forest Service and the National Association of State Foresters (Arbor Day Foundation 2014). Participation in the TCUSA program is voluntary, and contingent on communities meeting the following community forestry standards: 1) establishing a tree board or department with legal responsibility for tree care on municipal property; 2) enacting an ordinance to guide tree care; 3) committing to a community forestry program with an annual budget of at least USD $2 per capita; and 4) observing Arbor Day annually (Rosenow and Yager 2007; Arbor Day Foundation 2014). These standards enable communities of all sizes to participate in the TCUSA program. Approximately 3,400 communities participate in TCUSA, and over 135 million people reside in TCUSA communities (Arbor Day Foundation 2014).
The Arbor Day Foundation cites many benefits for communities participating in the TCUSA program (Rosenow and Yager 2007; Arbor Day Foundation 2014). For instance, TCUSA participation can promote citizen education and engagement, improve public image, and attract businesses and tourists (Rosenow and Yager 2007; Arbor Day Foundation 2014). From a management perspective, meeting the TCUSA standards provides a framework for participating communities to manage their forest resources effectively, and TCUSA communities are more likely to receive forestry grants and emergency funding (Rosenow and Yager 2007; Arbor Day Foundation 2014). Finally, prioritizing urban trees yields environmental benefits, such as reduced stormwater runoff and moderation of urban temperatures (Rosenow and Yager 2007). Berland and Hopton (2014) found evidence that TCUSA communities enjoy substantially higher reductions in modeled stormwater runoff from street trees than non-participants in the same region. On the other hand, Heynen and Lindsey (2003) did not observe a relationship between tree canopy cover and TCUSA participation, but they speculated that TCUSA participation may serve an important educational role and promote increases in canopy cover over time.
Although the realized benefits of TCUSA participation have received relatively little attention in the literature, continued participation by communities nationwide suggests they are experiencing positive impacts in terms of citizen engagement and public image, a framework for urban forest management, and/or environmental outcomes. Understanding the geographic distribution and socioeconomic characteristics of TCUSA participants is a first step to understanding potentially unequal distributions of TCUSA benefits, as well as the motivating factors and barriers to participation. In this vein, limited research has been conducted at the state level. In Maryland, U.S., more populous communities were more likely to participate in TCUSA, but participation was not related to demographic characteristics (Galvin and Bleil 2004). Similarly, Ries et al. (2007) noted that smaller communities in Oregon, U.S., were less aware of the TCUSA program.
While TCUSA participation has been analyzed for select individual states, national patterns have not been studied in depth. A national assessment of TCUSA participation was conducted to understand whether program participation varies according to geographic region, community size, or characteristics of the population. Assuming the TCUSA program offers benefits for participating municipalities, this assessment offers insight into the types of communities that are disproportionately more or less likely to enjoy the advantages of participation. In this study, the authors addressed the following questions:
Do TCUSA participation rates vary among U.S. regions?
Do TCUSA participation rates vary according to community population?
Is the duration of TCUSA participation related to community population?
Are communities more likely to participate in TCUSA if their neighbors participate?
Are TCUSA participation rates related to community characteristics, including income, education, housing tenure, race, and age of residents?
MATERIALS AND METHODS
Data Collection and Preparation
Researchers generated a list of TCUSA participants from the Arbor Day Foundation’s (2014) online directory. The directory was updated in April 2014, and the authors assumed that any changes in program participation from month-to-month had minimal impact on the findings of the study. To compare characteristics of participant and non-participant communities, a full set of so-called candidate communities, or those U.S. communities that could reasonably opt to participate in TCUSA based on community type and population, were developed. Candidate communities were identified in all fifty states, using 2012 American Community Survey (ACS) five-year estimate data (U.S. Census Bureau 2014). These census data were downloaded as polygon spatial data with demographic and economic variables included. For most states, researchers used census places to designate candidate communities. However, many TCUSA participants in the northeastern U.S. were not included in the census places data set, and so county subdivisions were included as TCUSA candidates in the following states: Connecticut, Massachusetts, New Hampshire, New Jersey, New York, Pennsylvania, Rhode Island, and Vermont. In these states, duplicates were removed for communities captured in both place and county subdivision data sets. A small number of counties (n = 18) and townships (n = 4) from ten other states were added to the list of candidate communities because they were TCUSA participants, but these cases were rare, so other counties and townships from these states were not considered TCUSA candidate communities.
Researchers restricted the candidate community list to those communities with population ≥2,500, which is the U.S. Census Bureau’s threshold for an urban locale. This was done because very small communities were highly unlikely to participate in TCUSA (3.1% participation rate for communities <2,500 population). This resulted in a list of candidate communities for all fifty states that included 11,355 communities ≥2,500 population. Among these, 2,673 communities were TCUSA participants (Arbor Day Foundation 2014). The candidate community spatial data (U.S. Census Bureau 2014) included ACS demographic and economic data and specific variables of interest are described hereafter. A binary TCUSA participation indicator (0 = no, 1 = yes) was associated with each candidate community.
Does TCUSA Participation Vary by U.S. Region?
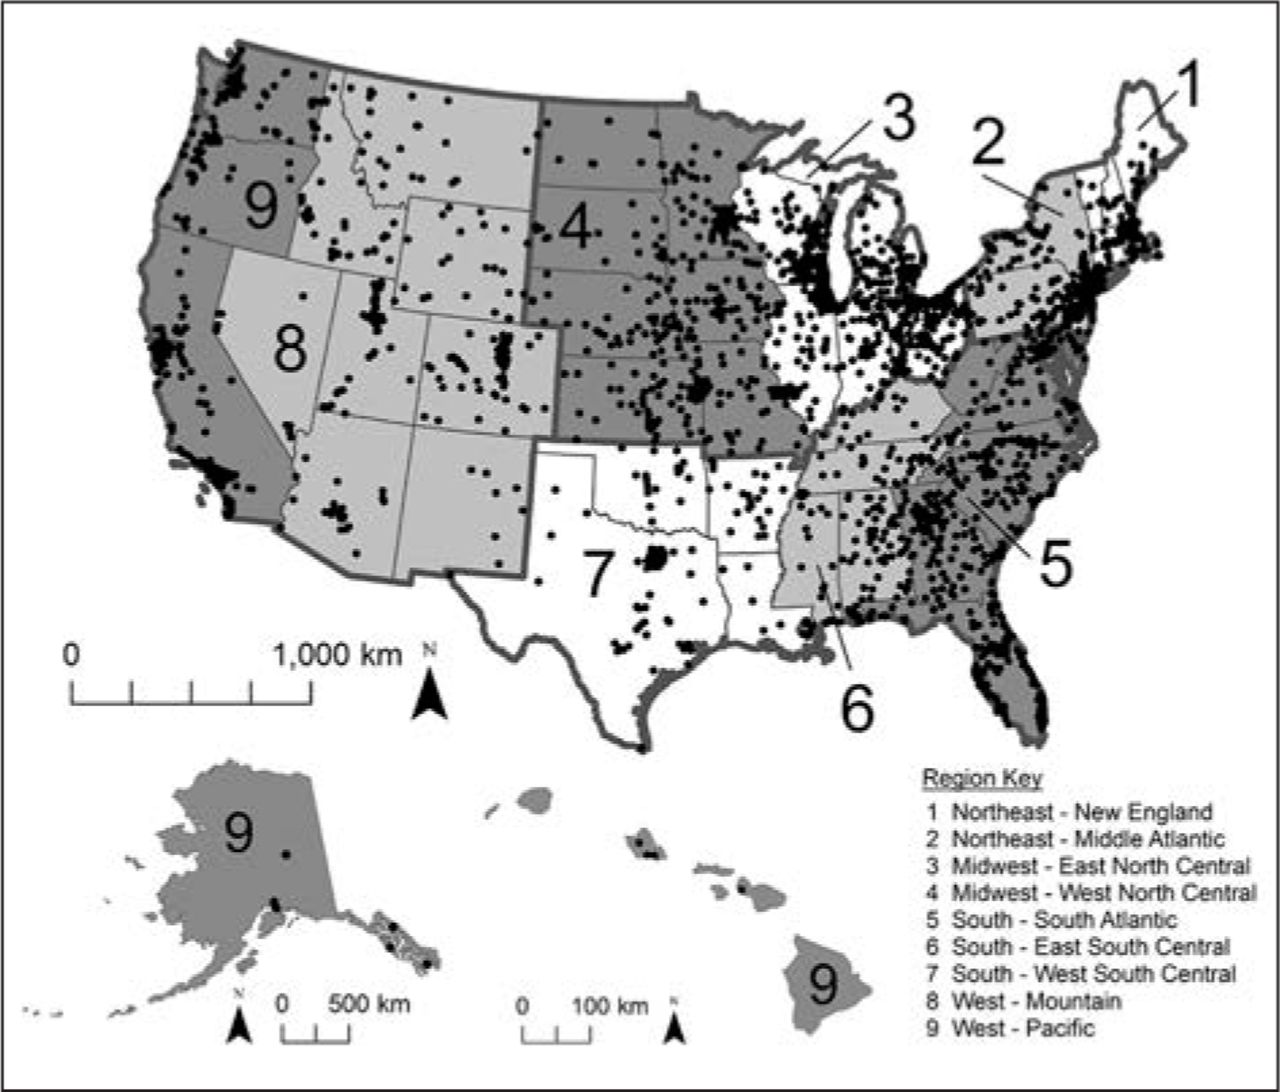
TCUSA participation rates were compared among U.S. regions. Nine regions were defined as groups of states based on U.S. Census Bureau regional divisions (Figure 1). Regions were used in recognition that there are differences in climatic, political, socioeconomic, and historical factors around the country that could impact TCUSA participation rates. For each region, researchers calculated the proportion of candidate communities (population ≥2,500) participating in TCUSA. Then Pearson’s χ2 test was used to determine if participation rates varied among regions. When the χ2 test was significant, a χ2 post hoc test was used to identify which regions varied from the rest of the regions. Researchers accounted for multiple hypothesis testing in post hoc tests using a false discovery rate correction (Benjamini and Hochberg 1995). Significant post hoc tests indicated a region contained either a higher or a lower proportion of TCUSA participants relative to the other regions. The χ2 tests were performed using R v3.1.2 (R Core Team 2014).

Tree City USA participants by U.S. region. Dots indicate Tree City USA communities over 2,500 population. Shading and numbers indicate U.S. regions. Regions were defined according to U.S. Census Bureau conventions.
Is Community Population Size Related to TCUSA Participation Likelihood and Duration of Participation?
Researchers hypothesized that larger communities would be more likely to participate in TCUSA. Logistic regression models were used to assess whether the likelihood of TCUSA participation varied according to community population. Separate models were constructed for the national data set and for each U.S. region depicted in Figure 1. In the logistic regression models, the dependent variable was a binary indicator of TCUSA participation, and community population was the independent variable. Community populations were log-transformed to meet model assumptions of normality. Spatial dependency was not observed in the model residuals, so researchers did not account for spatial autocorrelation in model specification. After the models were constructed, the predicted population at which a community had a 0.5 probability of participating in TCUSA was extracted.
It was hypothesized that longer-term TCUSA participants would have larger populations than more recent enrollees. A linear regression model was constructed for TCUSA participants in which log-transformed community population was the dependent variable, and the year of TCUSA adoption was the independent variable. Based on the hypothesis that larger communities would be longer-term TCUSA participants, an additional linear model was developed that included a quadratic term for the year of TCUSA adoption, as this curve may better capture a potential trend in the data introduced by saturation of TCUSA participation among larger communities. The original linear model was compared to the model with a quadratic term using the Akaike Information Criterion (AIC), where a lower AIC indicates the better model (i.e., the model that more successfully balances goodness of fit and parsimony). Logistic and linear regression models were constructed in R v3.1.2 (R Core Team 2014).
Are TCUSA Participants Spatially Autocorrelated?
A join-count statistic was calculated to determine if neighboring communities were more likely to participate in TCUSA than would be expected by random chance. The join-count statistic is a measure of spatial autocorrelation typically calculated using binary data, in this case TCUSA participants (coded 1) and non-participants (coded 0). Using a matrix of candidate community neighbor relationships, the statistic measures the frequency of 1-1, 0-0, and 0-1 joins and compares them to the frequencies expected under a random spatial distribution of the same number of 0 and 1 values. For the data set, the join-count statistic was used to evaluate, for each community’s four nearest neighbors, whether TCUSA participants were more likely to be joined than would be expected by chance. In other words, the join-count statistic was used to assess whether TCUSA participants were spatially autocorrelated. To assess significance, the authors compared the observed join-count statistic to a Monte Carlo simulation with 9,999 randomizations. Join-count statistics were calculated in R v3.1.2 (R Core Team 2014) using the spdep package (Bivand 2014).
Is TCUSA Participation Related to Socioeconomic Indicators?
Logistic regression analyses were conducted to model TCUSA participation as a function of several socioeconomic variables. In these logistic regression models, TCUSA was the binary response variable, and independent variables included the following demographic variables from the 2012 ACS five-year estimate data (U.S. Census Bureau 2014): income (median household income), education (high school graduation rate), owner occupancy (percent of housing units occupied by owner), percent white (percent of population that identifies their race as white alone), age (median population age in years), and total population. Independent variables were prescreened for excessive collinearity (|r| > 0.7; Dormann et al. 2013); this was not an issue, so all variables were included in the models. Communities with missing data values were excluded from further analysis. Separate models were constructed for each of nine census regions shown in Figure 1. A comprehensive national model was not developed because creation of a national connectivity matrix (see below) exceeded computational limits.
Inspection of logistic regression residuals indicated high spatial autocorrelation, which can lead to incorrect inferences by inflating degrees of freedom (Dormann et al. 2007). To address spatial autocorrelation in the models, the authors implemented spatial eigenvector mapping (SEVM), which has been shown to account for spatial autocorrelation in regression models (Dormann et al. 2007; Diniz-Filho et al. 2008). For each census region, spatial filters were developed using SEVM based on Gabriel connectivity matrices (following Diniz-Filho et al. 2008). These spatial filters describe the spatial arrangement of communities from the broadest patterns to increasingly finer-scaled patterns. Once extracted, the spatial filters can be included in the regression model as independent variables to account for spatial relationships among points. The first ten spatial filters were included as independent variables alongside community socioeconomic characteristics in the construction of each region’s logistic regression model. The decision to use ten spatial filters was based on sequentially adding filters until the Moran’s I statistic for model residuals was <0.05 in the first distance class (following de Oliveira and Diniz-Filho 2010). Overall model fit was assessed using the McFadden pseudo-R2; this metric yields lower values than traditional R2 calculations, as values from 0.20–0.40 represent excellent model fit (McFadden 1979). SEVM and logistic regressions were performed in SAM v4.0 (Rangel et al. 2010).
RESULTS
TCUSA Participation Varies by Region
In total, 2,673 candidate communities participated in TCUSA. These communities represented 132,271,497 people, or 53.9% of the total population in candidate communities. Among all candidate communities, the TCUSA participation rate was 23.5%, and ranged from 11.5% in the Middle Atlantic region to 44.4% in the West North Central region (Table 1). The regional comparison of TCUSA participation rates indicated highly significant differences among regions (χ2 = 827.7, P < 0.001). TCUSA participation rates were relatively low in New England, Middle Atlantic, West South Central, and Pacific regions. Conversely, participation rates were relatively high in East North Central, West North Central, and Mountain regions (Table 1).
Tree City USA (TCUSA) participation rates by U.S. region. Chi-square post hoc tests were used to determine whether each region’s participation rate was High, Low, or not significantly different (ns) from the rest of the U.S. (χ2 interpretation).
Community Population Relates to Likelihood and Duration of TCUSA Participation
The logistic regression models predicting TCUSA participation as a function of population were highly significant (P < 0.0001) for the national data set (Table 2; Figure 2) and for each U.S. region (Figure 3). In each model, the likelihood of TCUSA participation increased with population. Nationally, the predicted population at which a community had a 0.5 probability of participating was 46,262, but this value varied widely among regions (Table 2).
Logistic regression results predicting likelihood of Tree City USA participation as a function of community population (log).
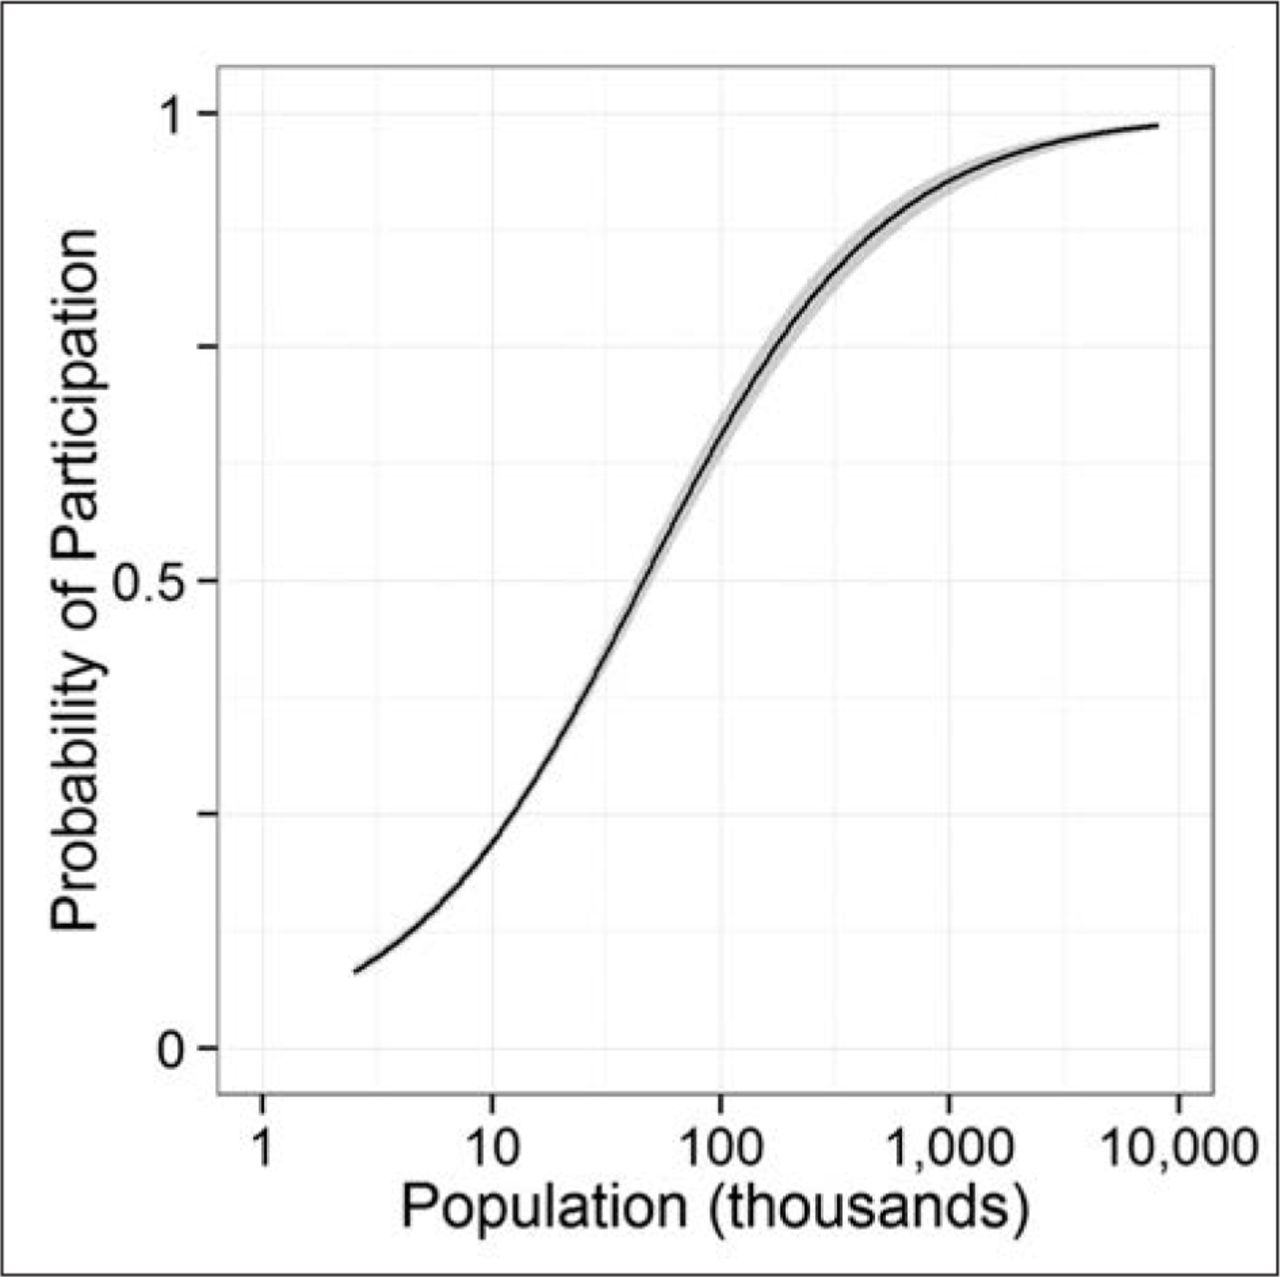
Logistic regression curve predicting likelihood of Tree City USA participation as a function of community population (log). The model fit is significant at P < 0.0001. Gray bands represent 95% confidence intervals. This regression curve applies to the national data set; see Figure 3 for regional curves.
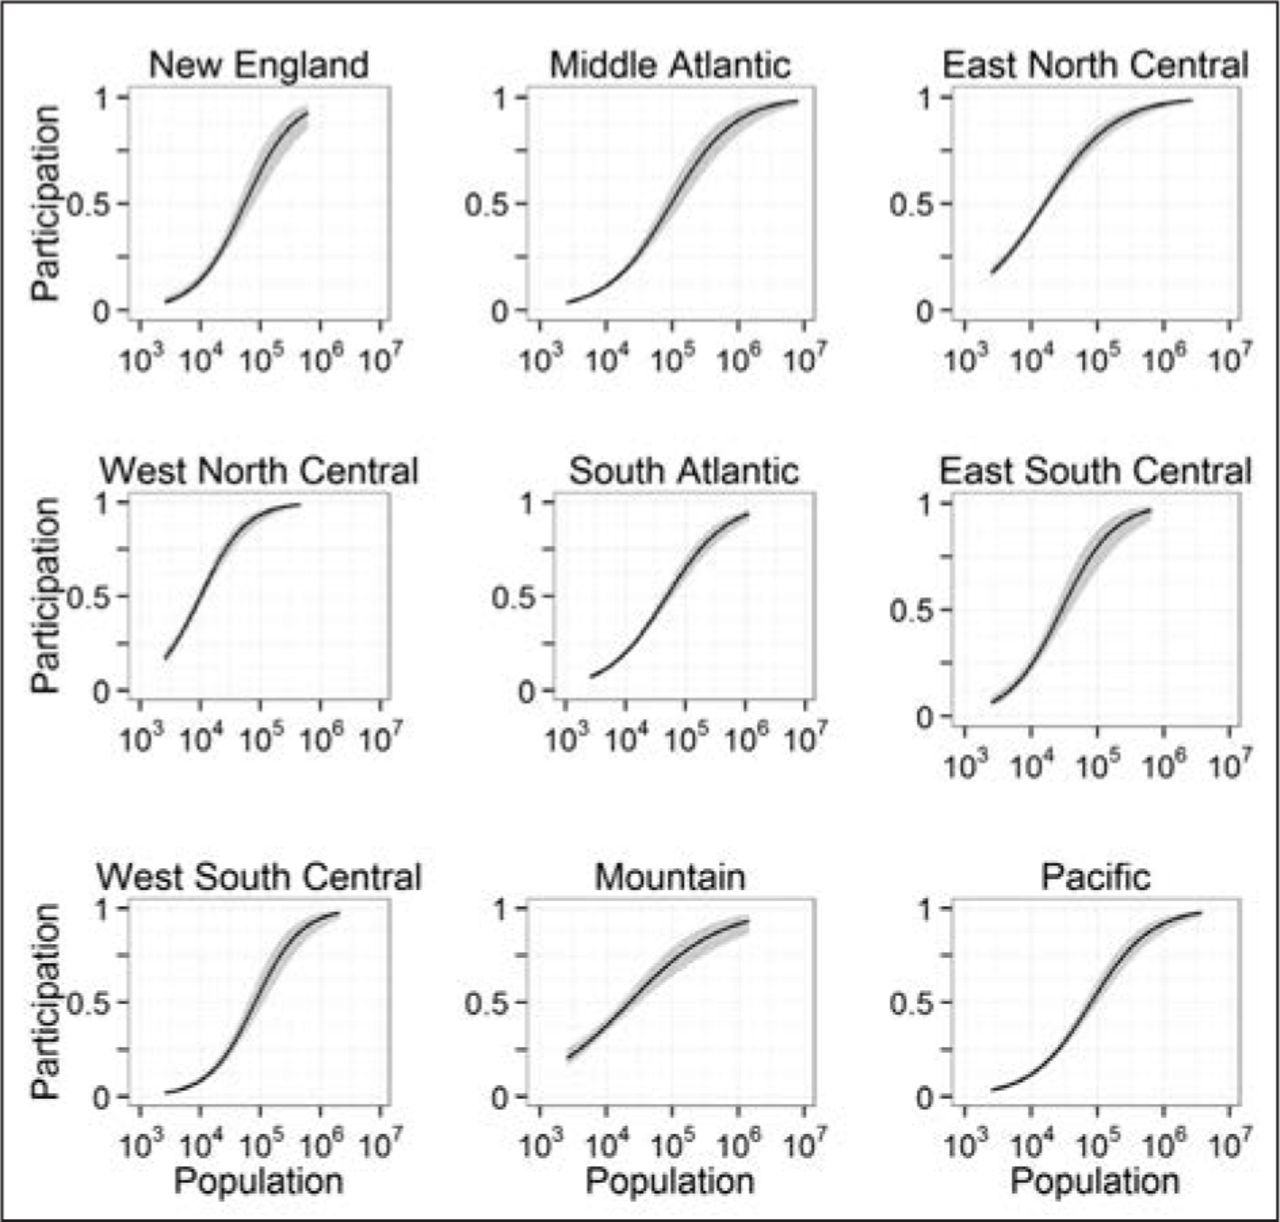
Regional logistic regression curves predicting likelihood of Tree City USA participation as a function of community population (log). All models are significant at P < 0.0001. Gray bands represent 95% confidence intervals. See Figure 1 for regional boundaries.
To assess the relationship between year of TCUSA adoption and community population, researchers used a linear regression with quadratic term based on its lower AIC score (8,573.4 versus 8,585.2 for the model without quadratic term). The model fit was highly significant (P = 0.0002), but the overall explanatory power of the model was limited (adjusted R2 = 0.05). The regression indicated a positive relationship between population and duration of TCUSA participation (Figure 4). The regression curve appears to flatten in recent years, indicating the population of TCUSA adopters is stabilizing over time (Figure 4).
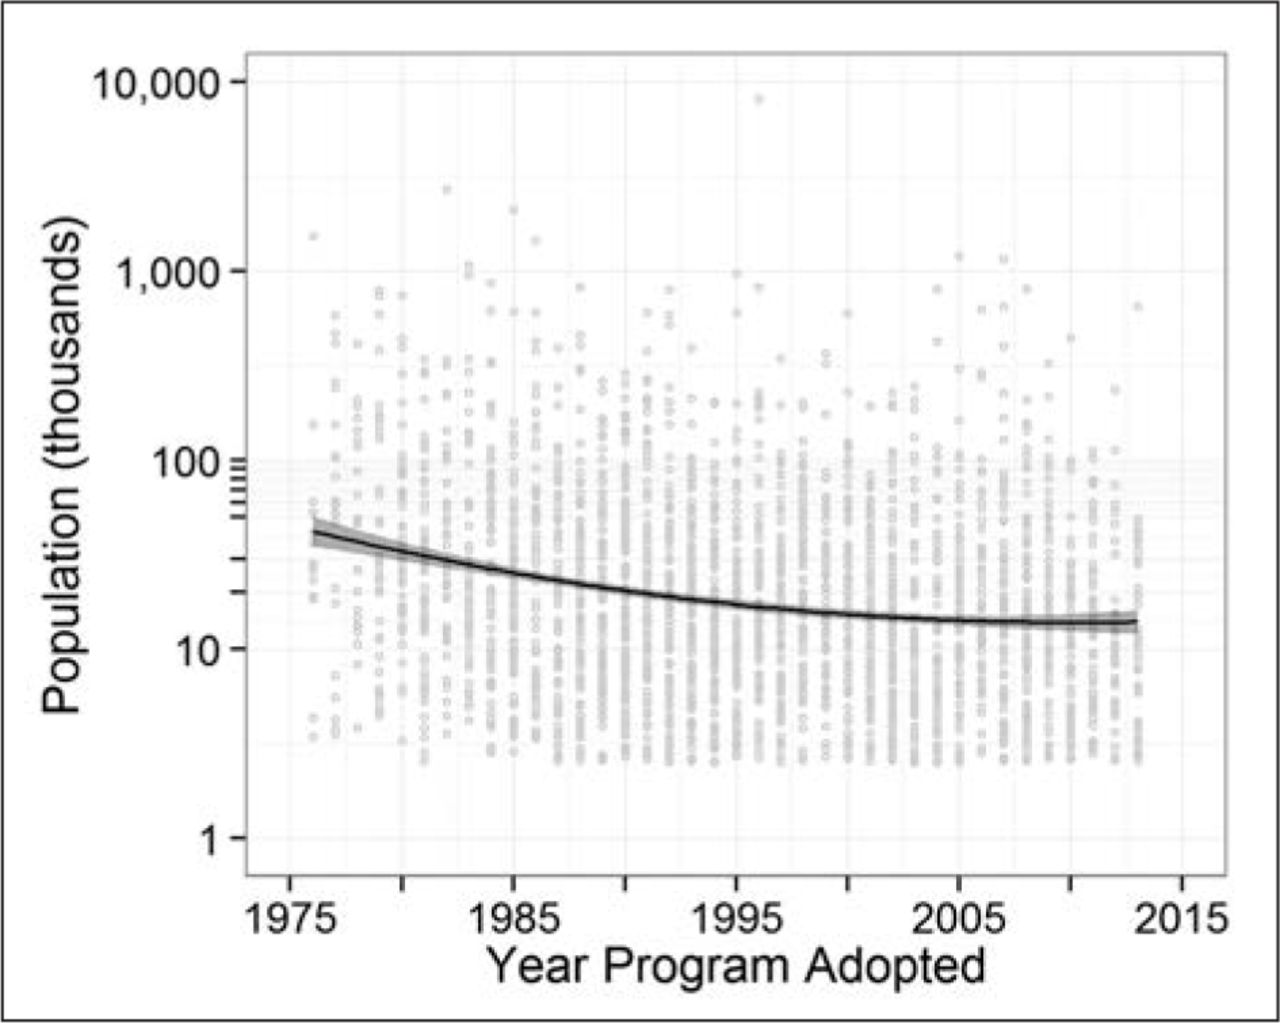
Regression curve describing the relationship between the duration of Tree City USA participation and the population of participant communities. Gray bands represent 95% confidence intervals, and gray dots denote participant communities. The regression is highly significant at P = 0.0002, but overall explanatory power is modest (adjusted R2 = 0.05). Note that population is shown on a log scale.
TCUSA Participants Are Spatially Clustered
TCUSA participant communities exhibited highly significant, positive spatial autocorrelation. The observed join-count statistic was 2,049.5 for 1-1 joins (P = 0.0001) and 14,090.5 for 0-0 joins (P = 0.0001); both values were higher than all data randomizations.
Socioeconomic Indicators Relate to TCUSA Participation
Logistic regression models were used to predict regional TCUSA participation. The inclusion of spatial filters as independent variables reduced residual spatial autocorrelation for each region (Moran’s I < 0.05 in the first distance class). The results of each model are shown in Table 3. In general, owner occupancy was the most consistently significant variable, as it was negatively associated with TCUSA participation in each region (i.e., TCUSA participation was generally lower where owner occupancy was higher). Total population was positively related to TCUSA participation in eight of nine regions, consistent with results presented in Figure 2 and Figure 3. Education was significantly and positively associated with TCUSA participation in seven regions, and percent white was a positive predictor in five regions (Table 3). Significant findings were not consistent for income (three positive relationships, one negative) or population age (three positive relationships, two negative) (Table 3). Model fit was deemed excellent in six regions (R2McFadden ≥ 0.20), and acceptable in the remaining three regions (R2McFadden = 0.15-0.16) (Table 3).
Standardized coefficients of logistic regression to model regional predictors of Tree City USA participation. Larger standardized coefficients represent a larger effect relative to other variables in the model. Positive coefficients denote a positive effect on Tree City USA participation, and vice versa. Spatial eigenvectors used to reduce spatial autocorrelation in model residuals are not shown among the independent variables. Bold values are significant at P < 0.05; values in bold italics are significant at P < 0.01.
DISCUSSION
Characteristics of TCUSA Communities
TCUSA participation was positively associated with community population nationally (Figure 2) and at the regional scale (Table 3; Figure 3). Furthermore, long-term TCUSA participants had higher populations than those enrolling more recently, and the population of new enrollees appears to be leveling off over time (Figure 4). Taken together, these results indicate that while larger cities were early adopters of TCUSA and were more likely to participate overall, smaller communities are closing the participation gap slowly over time. These findings are not surprising, as research has long shown that larger cities are early adopters of innovative programs (e.g., Crain 1966) and are more likely to have municipal tree programs (Zhang and Zheng 2012). This may be attributable to multiple factors, such as higher staffing or preexisting management structures in larger municipalities that facilitated enrollment in TCUSA, or perhaps residents in larger municipalities more actively supported the implementation of community forestry programs.
Note that the analysis only considered current TCUSA participants, and thus did not account for communities that stopped participating in the program at some point. TCUSA recertification rates for 2013 were >90% for most states (Arbor Day Foundation 2014), but it is possible that losing small numbers of participants each year would have appreciable effects over time. Regardless of how the findings are influenced by discontinued enrollments, it is apparent that larger communities are more likely to participate (Figure 2) and remain in the program over time (Figure 4).
Logistic regression analyses with socioeconomic indicators provided further insights into the characteristics of TCUSA communities. In every region, owner occupancy rate was negatively associated with TCUSA participation at P < 0.01 (Table 3). This potentially can be explained by a coincidence of relatively high TCUSA participation rates and low owner occupancy rates in urban areas compared to suburban and rural areas. According to the U.S. Census Bureau (2014), national owner occupancy rates are approximately 60% in urban areas and 79% in rural areas, so the statistical finding may be indirectly indicating a higher level of TCUSA participation near urban centers. This is corroborated by positive associations between TCUSA participation and population in eight of nine U.S. regions (Table 3). While researchers did not explicitly test whether TCUSA participation was higher in metropolitan areas than rural areas, the findings regarding owner occupancy and population suggest this was indeed the case. The implication of this pattern may be that community forestry programs, in general, are encouraging tree planting and maintenance where the private citizenry may be less motivated to do so. Past research has suggested that tree planting is less common on renter-occupied property because absentee property owners (who do not occupy the home) and renters (who do not own the property and may move away before benefits are realized) are both less motivated to plant trees than owner occupants (Perkins et al. 2004). By promoting publicly maintained trees, TCUSA potentially compensates in part for reduced tree planting on private property in communities with low owner occupancy rates.
Education (high school graduation rate) and percent white population were positively associated with TCUSA participation in seven and five U.S. regions, respectively (Table 3). Past research has identified instances in which tree canopy cover was distributed unequally according to education (Heynen and Lindsey 2003) and race (Landry and Chakraborty 2009). It is possible that uneven participation in TCUSA will perpetuate such inequalities in canopy cover because TCUSA requires active management and funding of community forestry programs. More broadly, if one assumes that TCUSA delivers on its goals to yield social, economic, and environmental advantages for participant communities (Arbor Day Foundation 2014), then reduced participation rates in communities with lower education levels or higher minority populations may signal regional-scale patterns of environmental injustice [for recent articles on environmental justice in the context of urban forestry, see Berland et al. (2015) and Schwarz et al. (2015)]. In other words, residents of communities with lower educational attainment or higher minority populations may not have equal access to the advantages provided by TCUSA. More information on the realized benefits of TCUSA participation (as opposed to expected or anecdotal benefits) is needed to more fully address this issue. Additional research is needed to understand why these patterns are restricted to certain regions, and why municipal leaders do not pursue TCUSA status in communities with lower educational attainment or higher minority populations. For example, is this pattern driven by scarce municipal resources, prioritization of other programming instead of community forestry, or is it attributable to a lack of program awareness, perceived benefits, or citizen interest?
The Geography of TCUSA Participation
TCUSA participation rates varied substantially among U.S. regions. The clearest national pattern was relatively low participation in the northeastern U.S. and high participation in the Midwest (compare Figure 1 and Table 1). Other patterns were less consistent. For instance, in the western U.S., participation rates were high in the Mountain region but low in the Pacific region (Table 1). The authors are unable to explain the variability in TCUSA participation rates among regions, but it is clear that opportunities exist to increase participation rates in all regions, and particularly in New England, Middle Atlantic, West South Central, and Pacific regions (Table 1).
Strategies to increase TCUSA participation likely need to be devised at regional or finer scales, because each region has unique population (Table 2; Figure 3) and socioeconomic (Table 3) profiles with respect to participation. For example, Middle Atlantic communities around 96,000 population have even odds of participating in TCUSA, whereas West North Central communities larger than 10,000 population are already more likely than not to participate (Table 2; Figure 3). As such, while it may be worthwhile to target Middle Atlantic communities around 100,000 population as new enrollees, participation may already be near saturation for larger communities in the West North Central, and efforts there may instead target smaller communities under 10,000 population. To improve the chances of success, efforts to increase participation in these two disparate regions would need to account for differences in institutional capacities between larger and smaller government units on top of other regional predilections. In light of regional differences, it may be appropriate to organize support for community forestry programs like TCUSA at the state level, perhaps through existing organizations (e.g., relevant state agencies or extension offices). State-level efforts would cast a relatively wide net while allowing for efforts to be tailored to the unique characteristics of each state.
Positive spatial autocorrelation in program participation suggests that communities are more likely to enroll in TCUSA if neighboring communities participate. This pattern could emerge spontaneously due to spatial clustering of communities with demographic profiles amenable to TCUSA participation (e.g., lower owner occupancy, higher education). Alternatively, the spatial autocorrelation could be explained by diffusion of ideas via professional networks, as municipal leaders would be more likely to share ideas with their counterparts in neighboring communities as opposed to more distant communities. Similarly, municipal leaders may feel pressure to participate in TCUSA as a means of upholding the community’s prestige in relation to its neighbors. Grove et al. (2006) described this phenomenon as an “ecology of prestige” for households within a neighborhood; here, researchers potentially observed an analogous desire to keep up with neighboring communities by enrolling in TCUSA.
Conclusions and Future Directions
In the U.S., TCUSA is the most prominent program recognizing a commitment to community forestry. The study was designed to provide a national overview of TCUSA participation according to geography, community size, and socioeconomic characteristics. In the analysis, nearly one-quarter of U.S. communities ≥2,500 population participated in TCUSA, and this represented over one-half of the total population in those communities. Program participation varied substantially among U.S. regions, from 11.5% of communities in the Middle Atlantic region to 44.4% in the West North Central region. TCUSA participation rates were higher in more populous communities, and long-term participants were more populous than recent enrollees. Across the majority of U.S. regions, TCUSA participation was negatively associated with owner occupancy rates, and positively associated with high school graduation rates and percent white population. These relationships could signal instances of environmental injustice if the presumed benefits of TCUSA participation are distributed unevenly with respect to educational attainment or racial composition. Patterns for income and median population age were less clear across regions. Finally, TCUSA participants exhibited positive spatial autocorrelation, as communities were more likely to participate if their neighbors participated.
This analysis represents the first national assessment of TCUSA participation, and as such, the findings provide novel insight into the characteristics of TCUSA communities. Continued research on TCUSA participation and attendant benefits will help improve community forest management, and the patterns described here can be used to frame future research questions. For example, identifying motivating factors and barriers to TCUSA participation could help gauge interest for TCUSA in non-participant communities, overcome barriers to participation, and reduce inequalities in program participation rates. In future analyses, additional factors, such as population density, existing tree canopy cover, and management responses to forest pests or changing municipal budgets, may provide insight into patterns of TCUSA participation over time and space. Finally, investigating the social (e.g., community education and engagement), economic (e.g., increased business and tourism activities), and environmental impacts (e.g., reduced stormwater runoff and urban heat island effects) of TCUSA could help quantify the advantages of participation, and may ultimately point to changes in the program that would help communities maximize the benefits associated with participation.
Acknowledgments
This research was performed while AB held a National Research Council Research Associateship Award at the U.S. Environmental Protection Agency (U.S. EPA). Partial support was provided to DLH through an appointment to the research participation program with the Oak Ridge Institute for Science and Education through the U.S. DOE and U.S. EPA. The views expressed in this article are strictly the opinions of the authors and in no manner represent or reflect current or planned policy by the U.S. EPA or other federal agencies. Mention of trade names or commercial products does not constitute endorsement or recommendation for use.
- Copyright © 2016, International Society of Arboriculture. All rights reserved.
LITERATURE CITED


Jump to section
Related Articles
Cited By...
- No citing articles found.