
Article Figures & Data
Figures
- Figure 1a.
Open-grown mature and immature samples used in this study (potted left of mature specimen). Pictured here: Chinese hemlock (Tsuga chinensis).
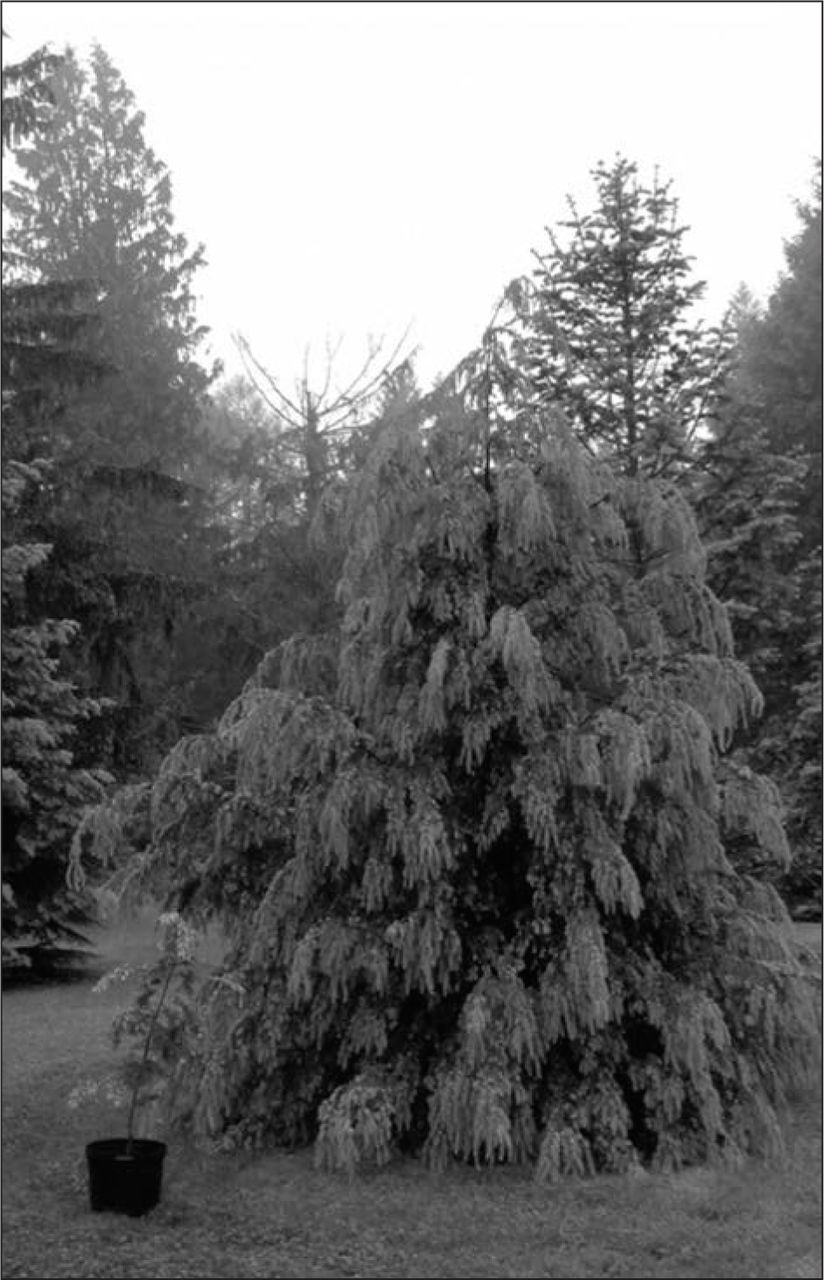
- Figure 1b.
Open-grown mature and immature samples used in this study (potted left of mature specimen). Pictured here: Eastern hemlock (Tsuga canadensis).

Tables
- Table 1.
Participant backgrounds, versus questions related to plant origin preference, purchase preference, and ability to detect specimen differences.
What is your background? Arborist Other Total Which specimen would you be more likely to purchase? T. chinensis 21% 28% 49% T. canadensis 17% 34% 51% Total 38% 62% 100% P-value df = 1 0.566z 0.339y Overall, would you agree or disagree that these two specimens are the same? Agree 12% 16% 28% Disagree 25% 47% 72% Total 37% 63% 100% P-value df = 1 0.748z 0.422y Would you be more or less inclined to purchase one of these specimens if it were naturally resistant? More inclined 27% 52% 79% Less inclined 4% 17% 21% Total 31% 69% 100% P-value df = 1 0.472z 0.325y Would you be more or less inclined to purchase one of these specimens if it required fewer insecticides? More inclined 31% 49% 80% Less inclined 2% 18% 20% Total 33% 67% 100% P-value df = 1 0.135z 0.086y - Table 2.
Participant ability to detect specimen difference, versus questions related to plant purchase preferences related to insect plant resistance, and few insecticide requirements.
Overall, would you agree or disagree that these two specimens are the same? Agree Disagree Total Would you be more or less inclined to purchase one of these specimens if it were naturally resistant? More inclined 29% 51% 80% Less inclined 2% 18% 20% Total 31% 69% 100% P-value df = 1 0.236z 0.147y Would you be more or less inclined to purchase one of these specimens if it required fewer insecticides? More inclined 28% 52% 80% Less inclined 2% 18% 20% Total 30% 70% 100% P-value df = 1 0.240z 0.159y
In this issue


Jump to section
Related Articles
Cited By...
- No citing articles found.