
Abstract
Million Trees LA (MTLA) is one of several large-scale mayoral tree planting initiatives in the United States, striving to create more livable cities through urban forestry. This study combined field sampling of tree survival and growth with numerical modeling of future benefits to assess performance of MTLA plantings. From 2006 to 2010 MTLA planted a diverse mix of 91,786 trees. Survivorship rates of 79.8%, 90.7%, and 77.1% for street, park and yard trees were relatively high compared to other studies. Growth rates averaged 0.99 and 1.1 cm DBH per year for street and yard trees. They were similar to rates for the same species in Claremont, California, U.S., and trees in other subtropical urban forests. Projected over 40 years, the amounts of CO2 stored per tree planted per year (20.1 kg), avoided emissions (27.7 kg), rainfall interception (1.5 m3), and air conditioning savings (47.4 kWh) exceeded estimates from a previous assessment. One reason is that MTLA has planted more larger-stature trees than anticipated. Avoided CO2 emissions from energy savings were relatively large because trees were judiciously located for building shade. Park tree plantings were projected to store the most CO2 (42.0 kg per tree per year) because of their large-stature and high survival rate. Although MTLA has not reached its goal of planting 1 million trees, early results suggest that it is achieving success in terms of tree survival, growth, and performance. Continued success will depend on proper tree care practices, strategically selecting and locating new trees, monitoring threats, and adapting to challenges that arise.
- California
- Carbon Monitoring
- Park
- Planting
- Sequestration
- Street Trees
- Tree Growth and Mortality
- Tree Planting Initiatives
- Urban Forestry
- Yard
Antonio Villaraigosa became mayor of the City of Los Angeles on July 1, 2005. The following day he planted a tree to announce his plan to plant one million trees, saying, “Los Angeles, the dirtiest big city in America, has the opportunity to be the greenest” (Hymon and Merl 2006). The ambitious tree initiative was called Million Trees LA (MTLA). Eight years and 407,000 trees later, Los Angeles has a new mayor, and the MTLA program continues to plant and steward trees with its partner organizations (Los Angeles Times Editorial Board 2013).
In 2006, the USDA Forest Service undertook a study to estimate future benefits from planting one million trees (McPherson et al. 2008b). This study replicates that assessment, but uses tree planting and survival data for the early years instead of preliminary estimates. Findings from the two studies are then compared to evaluate how MTLA trees are performing relative to the preliminary estimates. Tree survival and growth rates are compared to results from other programs and subtropical urban forests. This study serves as a benchmark for gauging MTLA’s future success and comparing with results from other large-scale tree planting initiatives (TPIs).
The MTLA Program
MTLA is one of several mayoral TPIs launched in the largest U.S. cities that have together pledged to plant nearly 20 million trees (Young 2011). The complexities associated with implementing the MTLA program are daunting (Pincetl 2010). MTLA does not take money from the city’s general fund. It is administered by the Department of Public Works and led by employees of the Million Trees LA Foundation, a non-profit organization. It has had a number of corporate sponsors, with many donations of in-kind services and materials. Resources are leveraged by MTLA from various city departments, as well as funding for tree planting from the Los Angeles Department of Water & Power (LADWP) and the South Coast Air Quality Management District. In 2009, the MTLA’s total operating budget was approximately $1.5 million. Grants (75%) and corporate sponsors (25%) were the major sources of funding.
Because Los Angeles is such a large city (3.8 million population; 1,225 km2), MTLA relies on its internal city departments and non-profit partners to deliver the program to neighborhood residents. The six nonprofit partners are: Fuego Tech Rangers, Hollywood/Los Angeles Beautification Team, Koreatown Youth & Community Center, Los Angeles Conservation Corps (LACC), North East Trees, and TreePeople.
MTLA has coordinated street, park, and yard tree planting projects. Street tree planting projects occur along heavily traveled corridors, where environmental benefits and program visibility are maximized by planting large trees. Street and yard tree planting projects occur in residential areas when trees are “adopted” by locals who agree to maintain the trees planted on their property or along the street. Tree adoption requests are parceled out by MTLA staff to the non-profit responsible for activities in the area. Residents are encouraged to report trees that they plant on private property via the MTLA website, but the numbers are small (1% to 2% of total planted). Also, LACC runs a residential shade-tree program that delivers trees directly to homes through an application process. Trained staff assists with tree selection and location, coordinates planting events, provides training on planting and tree care, supervises plantings, and conducts follow-up inspections to ensure trees are irrigated. Trees planted under supervision of the partner nonprofits are reported monthly by LACC, which purchases and distributes most of the trees.
Park tree planting projects are held in city parks managed by the Los Angeles Recreation and Parks Department (RPD). Events are organized by the non-profit TreePeople and supported by RPD. Tree-People trained over 6,660 volunteers who participated in 90 tree planting events from 2006 to 2010.
Preliminary MTLA Benefit Assessment
In 2006, U.S. Forest Service researchers began to address questions posed by the fledgling MTLA initiative—How many trees already exist in Los Angeles? Is there room for a million more trees? What environmental and other benefits will one million new trees provide? A satellite-based analysis determined that the canopy created by approximately 11 million trees covered 21% of Los Angeles (McPherson et al. 2011). Their preliminary benefit assessment incorporated several important assumptions regarding tree planting numbers, species mix, and survival rates.
Planting number and the annual rate at which trees are planted directly influence the future stream of benefits they provide. The mature sizes and growth rates of the species planted influence their leaf area and biomass. Generally, increased leaf area and biomass are associated with increased benefits, such as air pollutant reduction, rainfall interception, and carbon storage (Nowak et al. 1994, Xiao et al. 2000). McHale et al. (2007) found that mature tree size was the third most important variable influencing cost effectiveness of tree planting projects, because larger-stature trees stored more carbon. Several studies have found that estimates of future tree benefits are very sensitive to assumed survival rates (Hildebrandt and Sarkovich 1998; Nowak et al. 2002). For example, Morani et al. (2011) reported that doubling the average annual mortality rate from 4% to 8% resulted in a six-fold decrease in projected peak carbon storage. Strohbach et al. (2012) found that mortality had a stronger effect on carbon biomass in trees after 50 years than growth. Going from maximum to minimum growth rate [i.e., 0.71 and 0.58 cm per year diameter at breast height (DBH)] reduced biomass by 45%, compared to 70% going from low to high mortality (0.5% and 4% per year).
Based on discussions with MTLA planners, the preliminary study assumed that one million trees were planted during the first five years of the program at an increasing rate, from 50,000 in 2006 to 290,000 in 2010. Trees were distributed into mature-size classes based on the relative frequency of vacant planting sites obtained from remote sensing of unplanted irrigated grass areas. After calibrating remotely-sensed vacant tree sites with ground-truthed data, approximately 2.47 million planting sites were identified in Los Angeles; 52% were for small trees (4.6 m crown diameter at maturity). Hence, the assessment assumed that 52% of the one million trees planted were small-stature trees, 38% were medium trees (9.1 m crown diameter), and 10% were large trees (15.2 m). The analysis incorporated two scenarios that reflected a range of uncertainty regarding survival rates over a 35-year period (2006–2040). A low-mortality scenario assumed annual loss rates of 1% for establishment (the first five years after planting) and 0.5% for the remaining 30 years. The high-mortality scenario assumed annual loss rates of 5% during establishment and 2% thereafter. Overall survival rates for 35 years were 82.9% and 44.5% for the low- and high-mortality scenarios.
Over 35 years the value of benefits from planting one million trees was estimated to total $2.0 to $1.3 billion for the low- and high-mortality scenarios. These values translated into $1,951 and $1,328 per tree planted, or $56 and $38 per tree planted per year. The average annual benefit per tree planted was $4.37 and $2.78 for rainfall interception (low and high mortality), $3.35 and $2.16 for energy savings and $2.38 and $1.32 for air pollutant reduction.
Were these projected benefits overly optimistic or are they becoming a reality? Eight years is not sufficient time to conclusively answer this question. However, it is possible to identify trends that will influence future benefits. To assess these trends, this study examines the types of trees planted, their survival, and growth. Are they primarily large-stature trees capable of producing substantial benefits or smaller-stature trees, as assumed in the preliminary study? How do their survival and growth rates compare with those reported for other programs? This study is novel in its use of a TPI’s planting, growth, and survival data to identify trends that will influence future program benefits. The goals of this second study of the MTLA program are to: 1) evaluate the survival and growth of MTLA plantings during its early years because of their potential impact on future tree benefits, and 2) compare estimates of future benefits based on these data with those previously reported using preliminary data.
METHODS
Study Area
The study area covers 1,022 km2 of urban land in Los Angeles, California (latitude: 34°06′36″N, longitude: 118°24′40″W). The climate of Los Angeles is Mediterranean, characterized by hot, dry summers and cool, rainy winters from October through April. Average annual rainfall is 345 mm and the average annual and lowest temperatures recorded are 19°C and −4°C, respectively. Los Angeles has a variety of climate zones because of its proximity to the Pacific Ocean and nearby mountain ranges. Portions of Los Angeles fall into two of the sixteen U.S. climate zones that were used in the preliminary MTLA study for benefit calculation (McPherson et al. 2011). The two climate zones are hereafter referred to as Coastal and Inland zones.
Computer Simulations
This study uses computer simulation methods described in the initial MTLA assessment with a few exceptions (McPherson et al. 2008b). The simulation period is 40 years, instead of 35 years. Planting rates are based on reported numbers of trees planted, instead of a priori estimates. The simulation assumes that trees were planted in the spring for the first five years (2006 to 2010). Instead of using low- and high-mortality rate scenarios to simulate future benefits, this study uses a single scenario. Establishment period survival rates (first five years) are based on field sampled data. A single literature-based mortality rate is assumed for the remaining 35 years. This simulation and the previous analysis assumed that dead trees were not replaced. Results here are reported for trees planted in street, park, and yard locations to reflect observed differences in species composition, growth, and survival.
The accuracy of computer simulation estimates depends on the quality of underlying simplifying assumptions, as well as the numerical models. Assumptions known to influence results in substantial ways are described throughout this paper. However, a comprehensive sensitivity analysis has not been conducted, so the precision of each estimate can only be described in qualitative terms. To determine if the values reported here are reasonable, the values are compared to previously published estimates for trees in similar climate zones. Additional research is needed to determine the importance of simplifying assumptions, establish confidence bounds, and direct future research.
Tree Planting Survey
Information on the numbers and species of trees planted in street, park, and yard locations was obtained from 2006 to 2010. Street and yard data came from databases maintained by MTLA (pers. comm., Melinda Bartlett, Environmental Affairs Officer, MTLA, Los Angeles, CA; August 12, 2011) and the LACC (pers. comm., Meghan Shearer, Program Manager, LACC, Los Angeles, CA; August 23, 2011). The data were separated into Coastal and Inland climate zones. Street trees were further divided into #15 container (nominally 56.8 L) and #24 box (61 cm × 61 cm × 61 cm). Species names were missing for 31% of all street trees planted. To avoid overestimating ecosystem services by assuming that these unidentified trees were large-stature trees, they were matched to the medium-stature Jacaranda mimosifolia.
Information on the numbers and species of park trees planted was provided by the Los Angeles RPD (pers. comm., Laura Baurenfeind, Principal Forester, and Leon Boroditsky, Tree Surgeon, RPD; September 5, 2011). Although RPD did not track tree planting numbers by species, they provided monthly tallies of planting numbers in each of five management zones (i.e., Griffith, Metro, Valley, West, Pacific) and a list of the most frequently planted species based on nursery invoices. The distribution of trees among those species was assumed to follow the distribution for street and yard trees. All planted park and yard trees were #15 container.
Monitoring Tree Survival and Growth
Random samples of 98 street and 96 yard trees were surveyed during summer 2011 by LACC arborists. Street trees were planted between June 2006 and December 2007, while yard trees were planted between February and December 2006. Tree status was recorded as: present (same species as planted originally), present but different species, present but dead, not present but evidence it was planted, not present and no evidence tree was planted, and address not accessible. The DBH was measured for all live trees with a tape at 1.37 m above the ground to the closest 1.3 cm. Tree crown diameter was measured parallel and perpendicular to the nearest street or building with a tape to the nearest 0.3 m. Tree height was recorded, but data were found to be unreliable and were not used in the analysis.
Additional information was collected for modeling effects of sample trees on nearby building energy performance. Distance was measured if the tree was within 18 m of the nearest air-conditioned building and recorded by class: adjacent = 0–8 m, near = 8.1–12 m, far = 12.1–18 m. Azimuth, or the direction the tree lies from the nearest building, was measured with a compass and recorded as one of eight intercardinal directions (i.e., north, northeast, east). Buildings within 18 m of the tree were assigned to one of three vintages, where a vintage consists of buildings of similar age, construction type, floor area, and energy efficiency characteristics. Vintages were: 1) pre-1950: low insulation levels, small conditioned floor area (CFA), large window area:CFA ratios; 2) 1950–1980: more ceiling insulation, lower window area:CFA ratios; and 3) post-1980: more wall insulation, more CFA, lower window area:CFA ratios. The type of air conditioning equipment in the building nearest to the tree was recorded, where choices were: central air/heat pump, evaporative cooler, and wall/window unit. The extent to which buildings were retrofitted for energy efficiency could not be determined, which adds uncertainty to estimates of energy effects.
Modeling Tree Growth
Tree-growth models were developed from data collected on predominant street tree species growing in two reference cities—Santa Monica (Coastal) and Claremont (Inland)—and used as the basis for modeling tree growth (Peper et al. 2001). Using their tree inventories, a stratified random sample of 20 predominant species in Santa Monica and 22 species in Claremont were measured to establish relations among tree age, size, leaf area, and biomass. Biometric information (e.g., DBH, crown diameter, tree height, bole height) spanning the life cycle was collected for 30 to 60 trees of each species. Leaf area was estimated from computer processing of tree crown images obtained by using a digital camera (Peper and McPherson 2003). Linear regression was used to fit predictive models with DBH as a function of age for each of the sampled species. Predictions of crown diameter, leaf area and height metrics were modeled as a function of DBH using best-fit models (McPherson and Peper 2012; Peper et al. 2014).
Modeling Population Dynamics
Annual mortality rates during the first five years of establishment were based on data obtained from the street and yard tree field survey and a park tree monitoring study by TreePeople (pers.comm., Ryan Allen, Tree Care Manager, Tree-People, Los Angeles, CA; July 7, 2011). Annual mortality is defined by mannual = 1 – (Nt/No)1/t, where No and Nt are the number of trees sampled and the number alive at the end of the five-year interval t (Roman and Scatena 2011). The equation used to calculate the total number of live trees at the beginning of year t (TLTt) across species s is:
 1
1
After the five-year establishment period, annual mortality rates were assumed to be constant over time.
Species Matching, Biomass, and Carbon Dioxide Calculations
Each planted species was matched to one of the 20 or 22 species that were intensively studied in the reference cities following methods reported previously (McPherson et al. 2013). Correctly matching species planted to their corresponding reference city species ensured that the appropriate allometric and growth equations were applied to calculate biomass and annual sequestration rates.
To calculate biomass and CO2 stored in each tree planted, climate zone, species name, and DBH were used with 26 species-specific equations for trees growing in open, urban conditions. Urban-based biomass equations were developed from street and park trees measured in California (Pillsbury et al. 1998) and Colorado, U.S., cities (Lefsky and McHale 2008). The rationale for nearly exclusive use of these equations is that trees in open-grown conditions partition carbon differently than closely spaced trees in forest stands because they do not compete as directly with other trees. Also, urban tree growth can be enhanced by periodic irrigation and care, as well as elevated levels of carbon and nitrogen deposition (Jo and McPherson 1995; Nowak and Crane 2002).
Wood volume estimates were converted to green and dry-weight estimates (Markwardt 1930) and divided by 78% to incorporate root biomass (Nowak 1994a). Dry-weight biomass was converted to carbon (50%) (Leith 1975), and these values were converted to CO2. The amount of CO2 sequestered in year x was calculated as the difference between the amount stored in year x+1 and the amount stored in year x.
Calculation of Energy Effects and Avoided Emissions
Calculations of energy effects of street and yard trees on buildings were based on computer simulations that incorporated tree location and building vintage information from the monitoring survey. Climate and shading effects were modeled following methods outlined by McPherson and Simpson (1999). Park trees were omitted from the analysis because trees shaded very few air-conditioned buildings in parks. Changes in unit energy consumption due to the effects of trees were calculated on a per-tree basis by comparing results before and after adding trees. Weather data (e.g., hourly air temperature, wind speed, irradiance) for a typical meteorological year (TMY2) from Ontario International Airport (Inland) and Los Angeles International Airport (Coastal) were used (Marion and Urban 1995). Shading effects for each of the 20 to 22 tree species were simulated at three tree-to-building distances, eight orientations, and nine tree sizes.
The shading coefficients of trees in-leaf (i.e., gaps in the crown as a percentage of total crown silhouette) were estimated using a photographic method (Wilkinson 1991). Values for tree species that were not sampled, and leaf-off values for calculating winter shade, were based on published values (McPherson 1984). Foliation periods for deciduous trees were obtained from the literature and local arborists.
Tree distribution by location [e.g., frequency of occurrence at each location determined from distance between trees and buildings (four setback classes) and tree orientation with respect to buildings (eight azimuth classes)] was used to calculate average energy savings per tree as a function of distance and direction. Tree location distributions were from the random sample of 98 street and 96 yard trees. Simulated savings per tree at each location were multiplied by the percentages of sampled trees at each location to determine location-weighted savings per tree for each species and DBH class that was independent of location. Location-weighted savings per tree were multiplied by number of trees in each species and DBH class. These values were summed to calculate total savings for each year.
Unit energy consumption values for the simulated single-family residences were adjusted for type and saturation of heating and cooling equipment obtained from the field survey, and for various factors that modified the effects of shade and climate on heating and cooling loads (McPherson and Simpson 1999). These factors included differences in heating and cooling equipment, shade on adjacent buildings, shade from multiple existing trees and potential climate factors.
LADWP has a diverse fuel mix and the emission factor was 628.6 kg CO2 MWh−1 of electricity (McPherson et al. 2011). The emission factor for residential natural gas was 50,580 kg CO2 GJ−1. Avoided emissions were totaled for live trees each year. The values (USD$) of electrical energy ($0.106 per kWh) and natural gas ($0.0063 per MJ) were based on retail residential electricity and natural gas prices obtained from the LADWP and Southern California Gas.
Co-Benefits
Existing data on tree benefits for Coastal (McPherson et al. 2000a) and Inland southern California (McPherson et al. 2000b) provided a basis for projecting future annual co-benefits. Results are reported in resource units (RUs), such as kg NO2 deposited to tree surfaces from the atmosphere. A dollar value was assigned to each RU based on local costs (Table 1). To facilitate comparison of these results with the previous MTLA study, the same calculation methods and dollar values were used (McPherson et al. 2011).
Emission factors and the monetary value of reductions for Coastal and Inland climate zones. Currency is in U.S. Dollars.
Results are reported in terms of future annual value per tree planted and cumulative future value for the 40-year period. Co-benefits are not discounted and reported as present values because there is no attempt to evaluate efficiency or compare investments. If the intent was to compare the investment in MTLA with other investment opportunities, or compare different benefit streams from several planting scenarios, all future benefits would be discounted to the beginning of the investment period.
Air Quality
The hourly pollutant dry deposition per tree was expressed as the product of deposition velocity Vd = 1/ (Ra + Rb + Rc) (where Ra, Rb, and Rc are aerodynamic, boundary layer, and stomatal resistances), pollutant concentration, canopy projection area, and a time step. Hourly deposition velocities for ozone (O3), nitrogen dioxide (NO2), sulfur dioxide (SO2), and particulate matter of <10-micron diameter (PM10) were calculated by using estimates for the resistances Ra, Rb, and Rc for each hour throughout a “base year” (Scott et al. 1998). Deposition velocities accounted for each species’ leaf area during the in-leaf and out-of-leaf seasons. Hourly meteorological data and pollutant concentrations were obtained from monitoring stations in Hawthorne (Coastal) and Azusa (Inland), California, when pollutant concentrations were near average. Deposition was calculated for dry periods only.
Energy savings result in reduced emissions of criteria air pollutants [volatile organic hydrocarbons (VOCs), NO2, SO2, PM10] from power plants and space-heating equipment. These avoided emissions were calculated by using LADWP emission factors for electricity and heating fuels (Table 1).
The monetary value of tree effects on air quality reflects the value society places on clean air, as indicated by willingness to pay for pollutant reductions. Lacking specific data for Los Angeles, air quality benefits were monetized as damage values (Table 1) by using regression relationships among emission values, pollutant concentrations, and population numbers (Wang and Santini 1995). This regression provides estimates of the costs of damages to human health resulting from air pollution.
Rainfall Interception
Intercepted rainfall can evaporate from the tree crown, thereby reducing stormwater runoff. A numerical interception model accounted for the amount of annual rainfall intercepted by trees, as well as throughfall and stem flow (Xiao et al. 2000). The volume of water stored in tree crowns was calculated from tree crown leaf and stem surface areas and water depth on these surfaces. Hourly meteorological and rainfall data for 1996 from California Irrigation Management Information System stations in Santa Monica (Coastal) and Claremont (Inland) were used because total rainfall in that year was close to the average annual amount.
The rainfall interception benefit was priced by estimating costs of treating sanitary waste and controlling stormwater runoff in Los Angeles. During small rainfall events, excess capacity in sanitary treatment plants can be used to treat stormwater. In the Los Angeles region, it costs approximately $0.48 per m3 to treat sanitary waste (Condon and Moriarty 1999). Although storm drains are designed to manage 25-year events, localized flooding is a problem during smaller events. Approximately $50 million is spent annually controlling floods in Los Angeles and $1.42 per m3 is spent annually for controlling flooding caused by a typical 25-year winter event (170 mm) (Jones and Stokes Associates 1998). Water quality and flood control benefits were summed to calculate the total hydrology benefit of $1.90 per m3. This price was multiplied by the amount of rainfall intercepted annually.
RESULTS
Tree Planting and Mature Size
Information from the MTLA databases indicated that 91,786 trees were planted from 2006 to 2010 and 87.5% were planted in the Inland climate zone (Table 2). This amount is substantially less than the 407,000 reported as planted through 2013. The majority of trees (56,453) were planted in street locations (61.5%), with 73% of these along residential streets and the remainder along commercial streets. Approximately 22,861 trees (24.9%) were planted in private yards and 12,472 (13.6%) in parks. The number of trees planted each year ranged from 13,557 (14.8%) in 2006 to 24,608 (26.8%) in 2009. The MTLA planting palette contained a diverse mix of species, with 149 taxa planted along streets alone. However, 57 taxa had fewer than 20 individuals planted. The most abundant known species planted were Prunus cerasifera (6.3%), Lagerstroemia indica (4.6%), Quercus agrifolia (3.7%), Platanus spp. (2.5%) Jacaranda mimosifolia (2.2%), Ginkgo biloba (2.2%), Pistacia chinensis (2.2%), Magnolia grandiflora (2.1%), Pyrus kawakamii (2.0%), and Cedrus spp. (2.0%).
Distribution of planted trees by year, location (street, park, yard), and climate zone (Coastal, Inland).
Because the magnitude of ecosystem services trees produce in the long-term are directly related to their mature size, the percentages of small- (<10 m tall), medium- (10–20 m tall), and large- (>20 m tall) stature trees were calculated for street, park, and yard locations. Street tree species were quite evenly distributed among the three mature size classes. However, 65.5% and 14.0% of the park trees were large and medium stature, respectively. The opposite was found for yard trees, where 45.7% were small and only 14.2% were large.
Growth and Survival
The typical dimensions of a #15 tree at time of planting are 1.9 cm DBH and 0.6 m crown diameter. MTLA street (n = 67) and yard (n = 54) trees that were surveyed four to five years after planting had a mean DBH of 6.4 cm (S.E. = 0.43 cm) and 5.9 cm (S.E. = 0.41 cm), respectively. Mean crown diameter was 2.0 m (S.E. = 0.12 m) and 1.8 m (S.E. = 0.13 m) for street and yard trees. The average annual DBH and crown diameter growth rates for street and yard trees were 1.1 cm and 0.99 cm DBH per year and 0.36 and 0.30 m per year, respectively.
There was a threefold range in mean DBH and crown diameter among species sampled (Table 3). The largest species were Platanus acerifolia, Pistacia chinensis, Pyrus calleryana, and Olea europaea. The smallest trees were Lagerstroemia indica, Lophostemon confertus, and Magnolia grandiflora.
DBH (cm) and crown diameter (m) (means and standard errors) for the most frequently sampled species four to five years after planting (number of trees sampled).
The street tree survey found 67 trees alive, 1 dead, 16 missing, and 14 could not be located by the address provided (Table 4). The 14 trees with inaccessible addresses were removed from the sample, resulting in a 79.8% survivorship and 4.4% annual mortality rate for the first five years of street tree establishment. Three percent annual mortality rate was used for modeling thereafter, based on a recent meta-analysis of 16 street tree survival studies that found annual mortality rates typically ranged from 3% to 5% (Roman and Scatena 2011). The previous study assumed lower post-establishment loss rates, 1% and 2% for the low- and high-mortality scenarios.
Status and survivorship of sampled street and yard trees.
The random field survey of 70 yard trees found 54 alive and 16 missing. Survivorship was 77.1% and the average annual mortality rate was 4.6%. For modeling purposes, this rate was applied for the first five years, after which a 3% annual mortality rate was assumed. TreePeople conducted a three-year survey of 225 park trees planted in 2008 and found that 204 were alive in 2011 (90.7% survivorship) (pers. comm., Ryan Allen, Tree Care Manager, TreePeople, Los Angeles, CA; July 7, 2011). Based on these data, park tree average annual mortality rates were modeled as 5%, 4%, and 2% for years 1, 2, and 3 through 5 after planting, respectively. A constant rate of 1.5% was assumed for the remainder of the 40-year planning horizon.
The modeled street tree population reached 50,038 in 2010, then gradually dropped to 17,231 in 2045, or 31% of the number planted (Figure 1). The modeled park tree population had the highest survival rate, peaking at 11,349 and finishing at 6,687, or 54% of the 12,472 planted. Modeled yard trees exhibited the lowest survival, their population reaching 20,023 and closing at 6,895 (30%). Across all locations, 33.6% or 30,813 trees of the 91,786 planted were projected to survive until 2045.
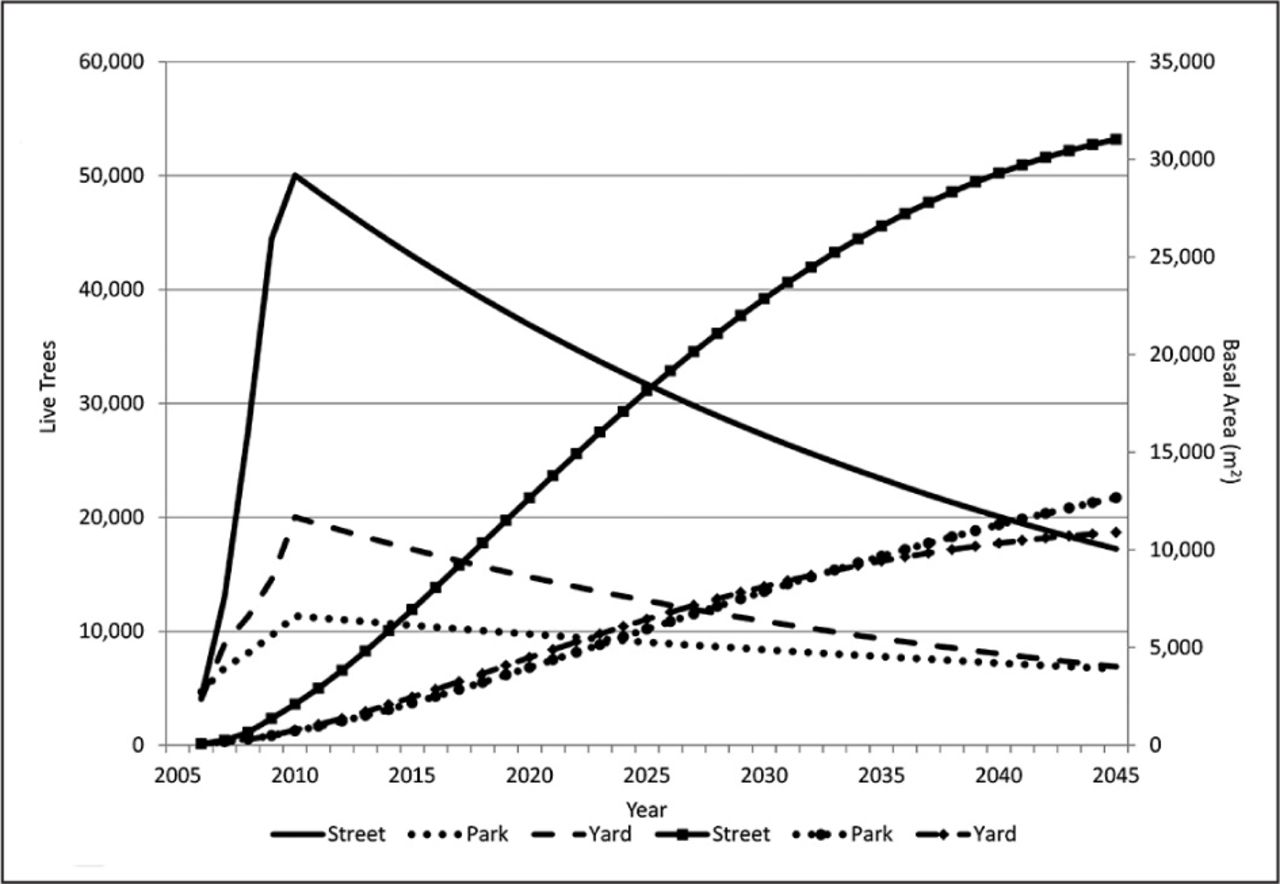
Data for live trees and basal area for street, park, and yard locations.
After 40 years, the simulated total basal area for street, park, and yard trees was 31,030 m2, 12,677 m2, and 10,896 m2 (Figure 1). Although over 10,000 more yard trees were planted than park trees, the total basal area of simulated park trees exceeded yard trees after the year 2032. Parks were planted with relatively more large-stature trees that had higher survival rates than simulated yard trees.
CO2 Stored and Avoided Emissions
The estimated amount of CO2 stored over the 40-year period was 73,703 metric tonnes (t), valued at $1 million, assuming a price of $14 per t (Table 5). Simulated street and park trees accounted for 55% and 28% of the total amount, respectively. Across all locations, the projected amount of CO2 stored per tree planted per year was 20.1 kg. Values ranged from 9.7 kg (Coastal, yard) to 44.2 kg (Inland, park).
CO2 stored and emissions avoided for street, park, and yard locations in Coastal and Inland climate zones.
Projected amounts of CO2 stored over the 40-year period varied among species (Figure 2). For example, 187 Quercus agrifolia planted in the Coastal streets location were projected to store 221 t CO2, or over twice the amount (92 t) stored by 523 Pyrus calleryana. Species that stored the most CO2 per tree planted were Platanus racemosa and Q. agrifolia (3.0 t), Pinus canariensis (3.3 t), and Fraxinus uhdei (5.4 t). Lagerstroemia indica (0.1 t) and Pistacia chinensis (0.4 t) stored the least.

Total CO2 stored and avoided emissions over the 40-year period for the most abundant species (numbers planted) in street, park, and yard locations for Inland and Coastal climate zones.
Avoided CO2 emissions attributed to shading and climate effects of trees on building energy use were estimated to total 101,679 t over 40 years ($1.4 million) (Table 5). Ninety-seven percent of this amount accrued Inland, where most trees were planted (69,173 versus 10,142 trees) and air conditioning loads are greater than in the Coastal climate zone. Across all locations, the projected amount of CO2 emissions avoided per tree planted per year was 27.7 kg. Values ranged from 7.7 kg (Coastal, yard) to 36.2 kg (Inland, street).
The effect of tree shade and air temperature reductions on cooling loads was estimated to be 116,909 MWh and 46,598 MWh in street and yard locations over the 40-year period (Table 6). These cooling savings translated into 102,779 t of avoided CO2 emissions. Trees were estimated to increase heating loads and associated natural gas consumption by 12,557 gigajoules (GJ) and 9,208 GJ for street and yard trees, respectively. Equivalent CO2 emissions totaled 1,101 t for 40 years.
Co-benefits in resource units (RUs) and U.S. dollars calculated over the 40-year period for street, park, and yard locations.
The proportion of CO2 stored and avoided emissions differed by climate zones, species, and location (Figure 2). Carbon dioxide reductions from avoided emissions were projected to exceed stored CO2 in the Inland climate zones (Table 5). In the more temperate Coastal zone, CO2 sequestration exceeded avoided emissions. Average annual avoided emissions per tree planted were greater for street trees than for yard trees (Table 5). Field survey results indicated that street trees were more effectively located for summer shade than yard trees. For example, 30.3% of the street trees sampled were located west of buildings, where savings are greatest, versus only 5.6% of yard trees. All sampled street trees were within 18 m of buildings and 83.3% were within 12 m, while 81.5% of all yard trees were within 18 m of buildings and 61.1% were within 12 m. Although a substantial number of yard trees (18.5%) were too far from buildings to provide shade, relatively more buildings sampled with yard trees had central air conditioning than did street trees (47.7% versus 20.6%).
Co-Benefits
Co-benefits were calculated annually and estimated to total $35.78 million for the 40-year period (Table 6). This value translates into $390 per tree planted and $9.75 per tree per year. Forty-eight percent of total benefits were energy savings, 29.4% rainfall interception, 13.3% air pollutant deposition, and 9.1% avoided air pollutant emissions from energy savings. The distribution of co-benefits was closely related to climate zone, as trees planted in the Inland climate zone accounted for 95.5% of total co-benefits. Co-benefits per tree planted averaged $426 ($10.64 per year) in the Inland zone and $139 ($3.48 per year) in the Coastal zone, where trees were smaller, air pollutant concentrations lower, and building heating and cooling loads less because of the milder climate. Simulated street and yard trees accounted for 91% of total co-benefits. Although park trees were forecast to grow larger and survive longer than street and yard trees, they were not as extensively planted (13.6%) and did not provide energy savings and associated avoided power-plant emissions.
By shading residential buildings and lowering summertime air temperatures, MTLA plantings were projected to reduce costs for air conditioning by $17.39 million. However, this cooling savings was partially offset by increased heating costs valued at $137,946. Despite this cost, net energy savings were projected to be $17.25 million for the 40 years (Table 6). The average annual energy co-benefit per tree planted over 40 years was $4.70.
By intercepting rainfall in their crowns, MTLA trees were projected to reduce stormwater runoff and protect water quality. Over the 40-year span, trees were estimated to intercept approximately 5.5 million m3 of rainfall. The value of this ecosystem service was estimated at $10.5 million. The average annual interception rate per tree planted over 40 years was 1.5 m3 valued at $2.86.
By removing pollutants from the air through deposition to tree surfaces, the tree planting was projected to improve air quality in Los Angeles and enhance human health. The value of this co-benefit was estimated to be $4.78 million over the 40-year planning horizon (Table 6). Interception of PM10 and uptake of O3 were especially valuable. O3 deposition and PM10 interception totaled 268 t ($2.2 million) and 147 t ($1.6 million), respectively. Uptake of NO2, an ozone precursor, was estimated at 103 t over the 40-year period ($858,799). The average annual deposition rate for all air pollutants per tree planted over 40 years was 0.14 kg, valued at $1.30.
Air pollutant emissions from power plants were estimated to be reduced because of energy savings. The MTLA trees were projected to reduce NO2 and PM10 by 195 t and 107 t ($1.7 and $1.2 million), respectively. Smaller amounts of SO2 and VOC emissions were reduced. Altogether, avoided emissions totaled 390 t ($3.25 million). The average annual avoided emissions per tree planted over 40 years were 0.11 kg, valued at $0.89.
DISCUSSION
Tree Planting and Mature Size
The number of trees planted (91,786) from 2006 to 2010 is substantially less than the targeted one million or the 407,000 reported as planted through 2013. Pincetl (2010) described some reasons for this, including lack of public funding during this era of fiscal constraint. An hedonic pricing analysis found that additional trees on housing parcels in Los Angeles would not appreciably increase property values, suggesting that there is little financial incentive for residents to pay for more trees (Saphores and Li 2012).
Using MTLA database information on tree species planted and the mature size of each, this study found percentages of small, medium, and large trees were 36.7%, 33.6%, and 29.7%, respectively. The preliminary study assumed percentages of 52.3%, 38.0%, and 9.7% for small, medium, and large trees, based on the size distribution of vacant planting sites. The MTLA program appears to be filling relatively more of the available vacant sites for large-stature trees and relatively few of the sites for small-stature trees. This finding is supported by the size distribution for the 152 sampled street and yard trees, which consisted of 27.6%, 37.5%, and 34.9% small, medium, and large trees, respectively. It appears that the MTLA program is preferentially planting larger-stature trees, probably to reap increased future benefits.
Survivorship and Growth
The MTLA average annual mortality rates for street (4.4%), park (3.1%), and yard (4.6%) trees were less than the 6.6% rate for Sacramento shade trees during the first five years (70.9% survivorship), as well as the 5.6% rate for small trees (<7.6 cm DBH) in West Oakland, California, U.S. (Roman 2013). Other studies have reported even higher average annual mortality rates for small trees, such as 9% in Baltimore, Maryland, U.S. (Nowak et al. 2004) and 12% for trees (7.7 to 15.2 cm) in Houston, Texas, U.S. (Staudhammer et al. 2011).
MTLA survivorship rates, 79.8%, 90.7%, and 77.1% for street, park, and yard, are comparable to the 78.2% reported for trees planted for three to six years in New York City, New York, U.S. (Lu et al. 2010). Miller and Miller (1991) reported street tree survival rates that ranged from 58.8% to 76.5%, four to nine years after planting in Wisconsin, U.S., communities. Somewhat higher survival rates were found for trees planted four to five years in San Francisco, California, U.S. (86.4%) (Sullivan 2004) and small Iowa, U.S. communities (87%) (Thompson et al. 2004).
In summary, MTLA tree survival rates are relatively high for a large city in an arid environment, where transplants face extended periods of summer drought. Results from analysis of a program in Sacramento similar to MTLA indicate that stewardship and maintenance are the most critical factors influencing young tree survival (Roman 2013). Activities that may increase survival include more frequent site visits, follow-up tree care tips, systematic monitoring, and planting of species with high survival rates, such as those that are drought tolerant.
MTLA tree growth rates compare favorably with values reported in the literature. The average annual DBH growth across all species was 1.06 cm per year (n = 121) for four- and five-year-old trees. This mean DBH growth rate is greater than 0.56 and 0.82 cm reported for trees with DBH less than 7 cm in commercial and residential land uses in Gainesville, Florida, U.S. (Lawrence et al. 2012). Also, it exceeds the 0.85 cm per year reported for the same size trees in Chicago, Illinois, U.S., in part because of a longer growing season in Los Angeles (Nowak 1994b). It is comparable with the mean growth of larger trees (7.7 to 15.2 cm) in Houston (1.01 cm) and Gainesville (1.11 cm) (Staudhammer et al. 2011).
Mean DBH for two of the most frequently sampled street tree species, Platanus spp. and Pyrus calleryana, were 9.1 cm (S.E. = 2.03 cm) and 7.6 cm (S.E. = 1.09 cm), respectively. These sizes fall within the 95% prediction intervals (α = 0.05) for the same species at four to five years after planting in Claremont, California, U.S., which has a storied municipal forest program (Wright 1999) (Figure 3). Overall, MTLA trees are growing vigorously and on track to achieve the stature predicted by this study’s tree growth models (McPherson et al. 2008a).
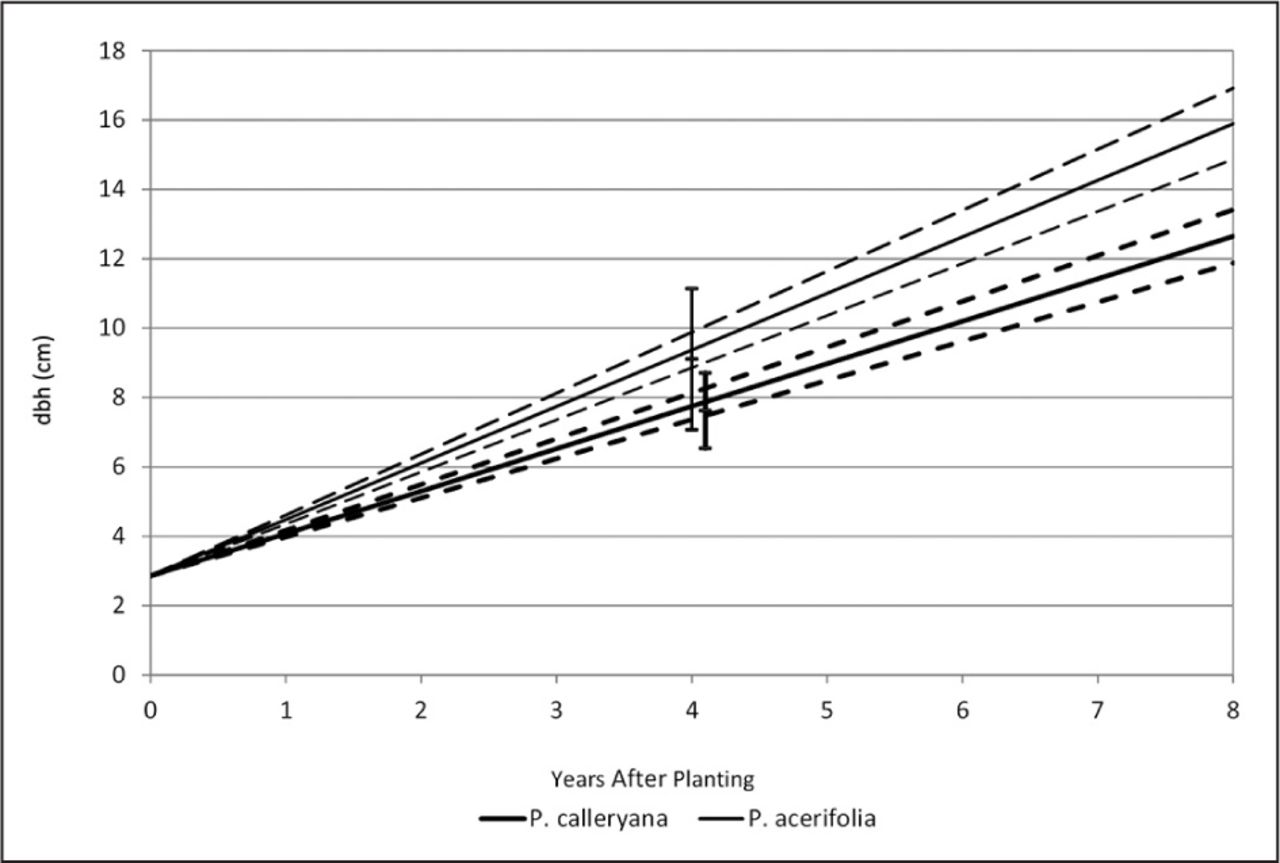
DBH (means and standard errors) for four- to five-year-old Platanus spp. and Pyrus calleryana. Dashed lines are 95% prediction intervals (α = 0.05) from growth equations for street trees of the same species measured in Claremont, California, U.S. Note that the quadratic growth equation appears linear for the first eight years.
Carbon Dioxide Stored and Avoided Emissions
MTLA trees were projected to store CO2 and avoid emissions in the amounts of 20.1 kg and 27.7 kg per tree planted per year, respectively. These values are best compared to the three studies that simulated biomass accumulation from tree plantings over a 30- to 50-year period.
In the initial study of the MTLA program, planting one million trees was estimated to sequester and reduce emissions by 10.1 kg and 12.9 kg per year per tree planted, respectively. In both this study and the preliminary study, avoided emissions are 120% to 130% greater than sequestration. However, annual values per tree planted from the preliminary study are about 50% of those reported in this study. One explanation for the discrepancy is that this study assumed planting of relatively more, larger-stature trees.
Kovacs et al. (2013) estimated net CO2 reductions from planting 182,736 street trees in New York City over 50 years. The amounts of CO2 sequestered and emissions avoided per tree per year varied by species, ranging from 13.2 to 52.1 kg and 25.7 to 52.1 kg per year, respectively. Sequestered CO2 values are similar to the 20.1 kg value reported here. The avoided emissions values are somewhat higher than reported here, in part because trees were projected to provide substantial heating savings from wind speed reductions.
McHale et al. (2007) estimated the amounts of CO2 sequestered and emissions avoided over 40 years for plantings in the Denver, Colorado, U.S., region. Sequestered and avoided CO2 ranged from 7.2 to 11.2 kg and 5.3 to 11.5 kg per tree per year, respectively. These values are somewhat less than the 20.1 kg and 27.7 kg per year per tree planted as reported here. The Denver region’s shorter growing season is partially responsible.
Estimates from this study can be compared to results from urban forest inventories, although the two are fundamentally different. This study modeled biomass accumulated throughout the 40-year project lifetime, while inventories are a snapshot in time that reflect the current mix of tree species and sizes. The amounts reported here are over twice the amounts reported for Los Angeles’s existing urban forest, which were 9.6 kg and 9.1 kg of CO2, respectively (McPherson et al. 2013). The higher values reported here reflect differences in the mix of species and their wood densities, as well as their sizes and locations relative to the buildings they shade.
The average amount of CO2 sequestered per tree per year by urban forests in Miami-Dade (28.0 kg) and Gainesville, Florida, U.S. (21.2 kg) are slightly greater than the 20.1 kg reported here for MTLA, but avoided emissions are substantially less than 27.7 kg (2.3 and 6.4 kg per tree per year) (Escobedo et al. 2010). Existing trees in these urban forests are not achieving emission reductions comparable to CO2 stored. MTLA trees are projected to achieve emission reductions in excess of CO2 stored, suggesting that trees are strategically selected and placed to achieve energy savings.
Co-Benefits
To compare co-benefits calculated for this study with the preliminary assessment, estimates are evaluated on a per tree planted per year basis. Values for the preliminary study’s high mortality scenario are compared because its 55.1% loss rate is closest to the 66.4% assumed in this study.
Rainfall intercepted annually per tree planted was similar, 1.46 m3 ($2.78) and 1.50 m3 ($2.86) for the preliminary and current studies, respectively. Other co-benefit values were greater for this study than the preliminary study. For example, total annual air pollutant deposition and avoided emissions increased from 0.17 kg to 0.25 kg per tree ($1.52 to $2.19). Air conditioning energy savings increased from 20.5 kWh to 44.5 kWh per tree ($2.18 to $4.74) per year. These increases reflect differences in the mix of trees planted and associated estimates of their growth. Planting of relatively more, larger-stature trees is primarily responsible for greater co-benefits reported for this study compared to the preliminary assessment.
Management Implications
These findings suggest several ways that MTLA managers can continue to select and locate trees to produce long-term reductions in atmospheric CO2. On average, park trees stored much more CO2 per tree planted (1.68 t) than street (0.72 t) and yard (0.54 t) trees. Selecting large-stature trees with high wood densities will maximize these benefits. Although smaller-stature yard trees stored the least CO2, they provided substantial energy savings and avoided emissions per tree planted (1.26 t). These benefits can be increased by strategically locating yard trees to shade the west walls of air conditioned buildings. There is more potential to plant large-stature trees along streets than in yards. The CO2 storage potential of street trees can be actualized through planting such trees where space permits. This strategy will promote energy savings as well, except when evergreen street trees are planted south of buildings and winter irradiance is attenuated.
Limitations and Uncertainty
This study based initial estimates of CO2 stored and emissions avoided on field-sampled tree size, location, and mortality data. For tree growth, standard errors are 6% to 7% of the estimates, indicating that sampling error is a source of error. Measurement errors have a relatively small effect, on the order of ± 1% to 3%.
Simulation results are highly sensitive to tree species and assumed survivorship rates. Information on species planted was lacking for street and park locations. The assumption that the distribution of unknown species followed the distribution of known species was not tested. Although the annual post-establishment mortality rates used here (1.5% and 3%) are within the range of those reported in the literature, in reality they will not remain constant each year. Research is needed to specify more precise values.
Matching nearly two hundred species to the 42 representative species is another source of error. The magnitude of this error depends on the proportion of population that must be assigned a species match, as well as goodness of fit in terms of matching size and annual growth rate. Given the attention paid during this study to assigning allometric equations, dry weight wood density values, and species matching, estimates of carbon sequestration may have uncertainty as great as ±10 percent (Aguaron and McPherson 2012).
Formulaic errors occur in modeling of energy effects from tree shade and climate modification. For example, relations between different levels of planting and summertime air temperatures are not well-researched. Another source of error stems from differences between the airport climate data used to model energy effects and the actual climate of the study area. These simulations neglect climate change impacts likely to occur in the future, as well as local-scale heat island effects. Trees located too close to buildings can be a liability when roots cause damage to the foundation or pests invade, such as termites. Because of the uncertainty associated with modeling effects of tree shade on building microclimate and energy use, estimates of avoided emissions may be accurate within ± 25% (Hildebrandt and Sarkovich 1998, California Air Resources Board 2011). In summary, formulaic and estimation errors are relatively large, while sampling and measurement errors are relatively small.
The benefits quantified here should be considered a conservative estimate because they are not a full accounting. They do not include many other benefits that are more difficult to monetize. For example, tree shade on streets can help offset pavement management costs by protecting paving from weathering (McPherson and Muchnick 2005). Also, there is growing evidence that trees provide public health benefits. Tree loss from emerald ash borer (Agrilus planipennis) has been correlated with increased mortality related to cardiovascular and lower-respiratory-tract illness (Donovan et al. 2013). Although emerald ash borer is an emerging threat in California, the polyphagous shot hole borer (Euwallacea sp.) and gold-spotted oak borer (Agrilus auroguttatus) are present in the Los Angeles region and pose grave threats to the urban forest, with potentially adverse impacts on human health.
This study did not quantify MTLA program costs, which include planning, site preparation, tree production and planting, stewardship (e.g., irrigation, pruning), monitoring, outreach, and administration. Future research is needed to calculate MTLA’s net benefits, as well as environmental impacts at each stage of its life cycle.
CONCLUSIONS
In the eight years after Mayor Villaraigosa launched MTLA, 407,000 trees were planted and the program is now part of the green fabric of Los Angeles, California. Although the 91,786 trees planted from 2006 to 2010 is substantially less than the targeted one million, findings from this study indicate that survivorship over the first five years exceeded rates reported for comparable cities. Moreover, sampled MTLA trees are growing at rates typical for the same species in Claremont, California, and trees in other subtropical urban forests.
This study’s projected amounts of CO2 stored, avoided emissions and co-benefits per tree planted exceeded estimates from the initial assessment. One reason is that MTLA is planting large-stature trees in greater proportion than their distribution as vacant planting sites (30% versus 9%). Also, avoided CO2 emissions from energy savings were substantial for both street and yard trees, indicating that they are being selected and located for building shade. Park tree plantings were projected to store the most CO2 per tree planted because 80% were medium- and large-stature species and survival rates were high.
Although MTLA planted less than one-half of its ambitious target, it would be short-sighted to call the program a failure for this reason alone. Many more trees were planted than were being planted previously. Most importantly, these early results suggest that MTLA is achieving a high level of success in terms of tree survival, growth, and benefits produced. Continued success will depend on raising awareness of proper tree care practices, strategically selecting and locating new trees, monitoring threats, and adapting to the challenges that arise. As the MTLA program enters a new chapter of its life, it has an opportunity to lead others by renewing its focus on sustaining the trees that it plants.
Acknowledgments
I am deeply indebted to the many partners who assisted with this study. Los Angeles Conservation Corp’s Meghan Shearer led field data collection, while Dan Knapp provided tree planting information. MTLA staff Lisa Sarno, Elizabeth Skrzat, Melinda Bartlett, and Thalia Uribe shared their database and described their program. George Gonzalez and Ron Lorenzen (LA Bureau of Street Services) as well as Laura Baurenfeind and Leon Boroditsky (LA Recreation and Parks Department) generously outlined their programs’ specific tree planting and stewardship activities. Ryan Allen (TreePeople) shared data on park tree planting and survival rates. Drs. James R. Simpson, Lara Roman, and Alissa Kendall (UC Davis), Paula Peper and Shannon Albers (USDA Forest Service, PSW Research Station) provided technical support during portions of the study.
- © 2014, International Society of Arboriculture. All rights reserved.
LITERATURE CITED


Jump to section
Related Articles
Cited By...
- No citing articles found.