
Article Figures & Data
Figures
- Figure 1.
Commercial growing media was removed from the root systems of Dracaena fragrans (a, b) and Syzygium grande (c, d) to access the bottom of the stem, and longitudinal voids were subsequently introduced using wood auger drill bits. Inadvertent root damage was avoided insofar as possible during the void introduction process.
- Figure 2.
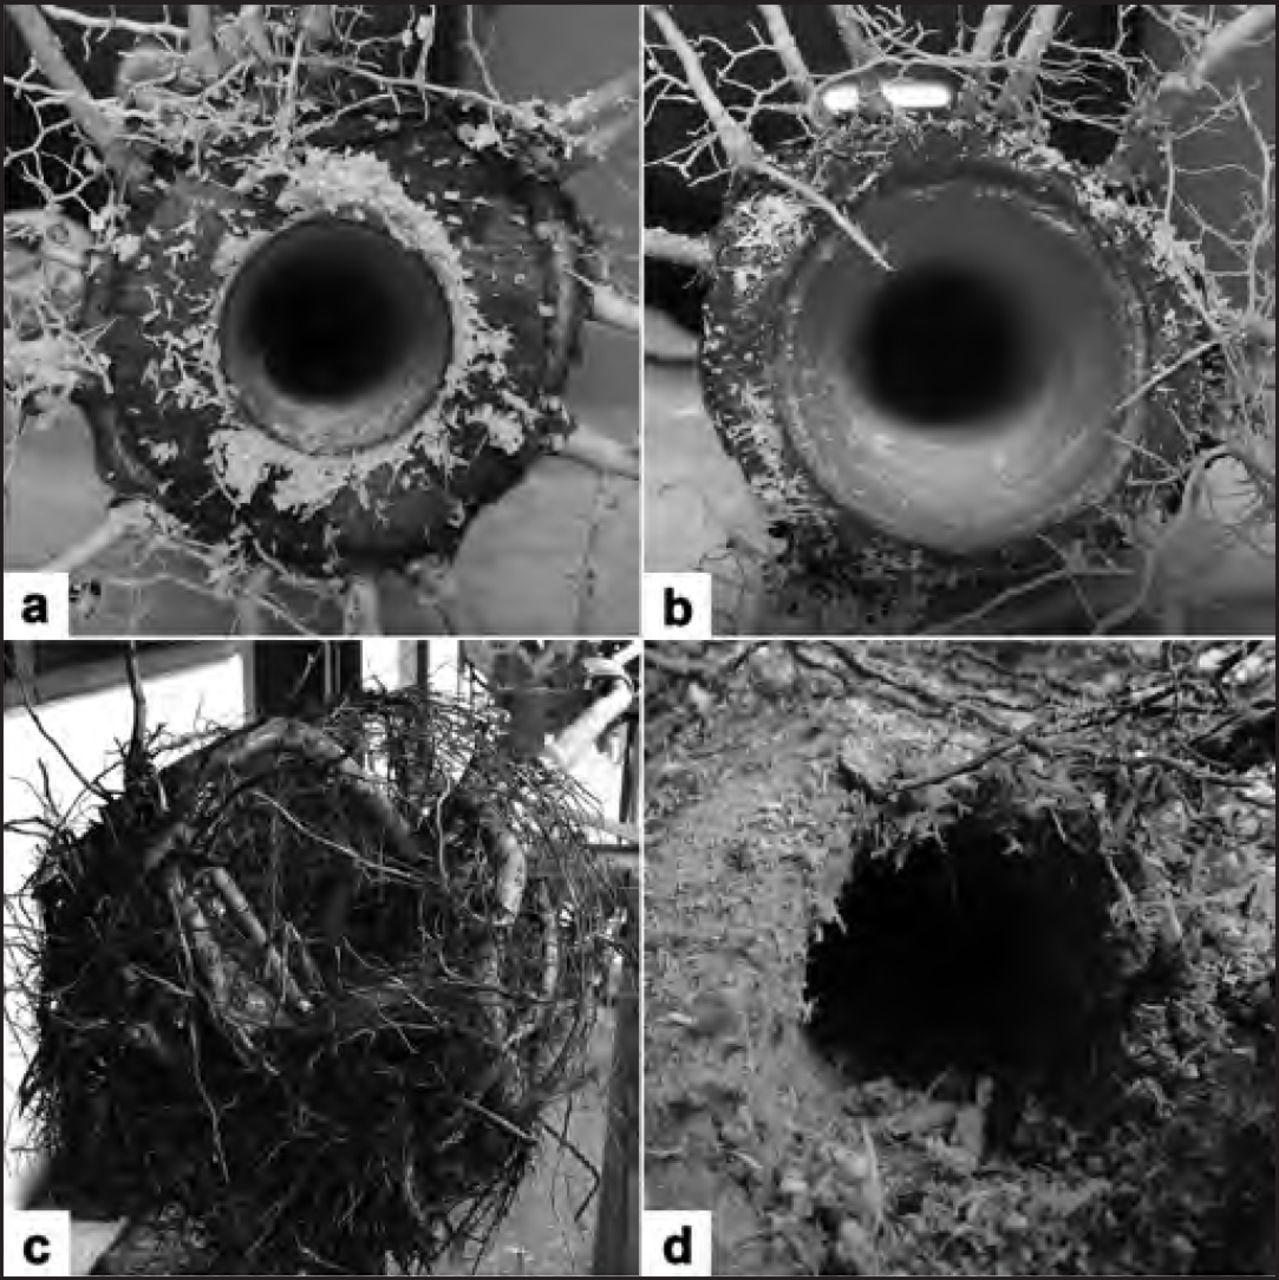
The mechanically induced voids ranged in size from 1.3 to 3.8 cm diameter in both Dracaena fragrans (a) and Syzygium grande (b). The voids were oriented axially along the stem center (pith in S. grande) and extended between 5 and 35 cm above the root flare.
- Figure 3.
Temperature data were extracted from longitudinal rectangular transects positioned horizontally and central across the stem surface overlying the internal voids (left) and three evenly distributed lines longitudinally oriented along the stem surface (right).
- Figure 4.
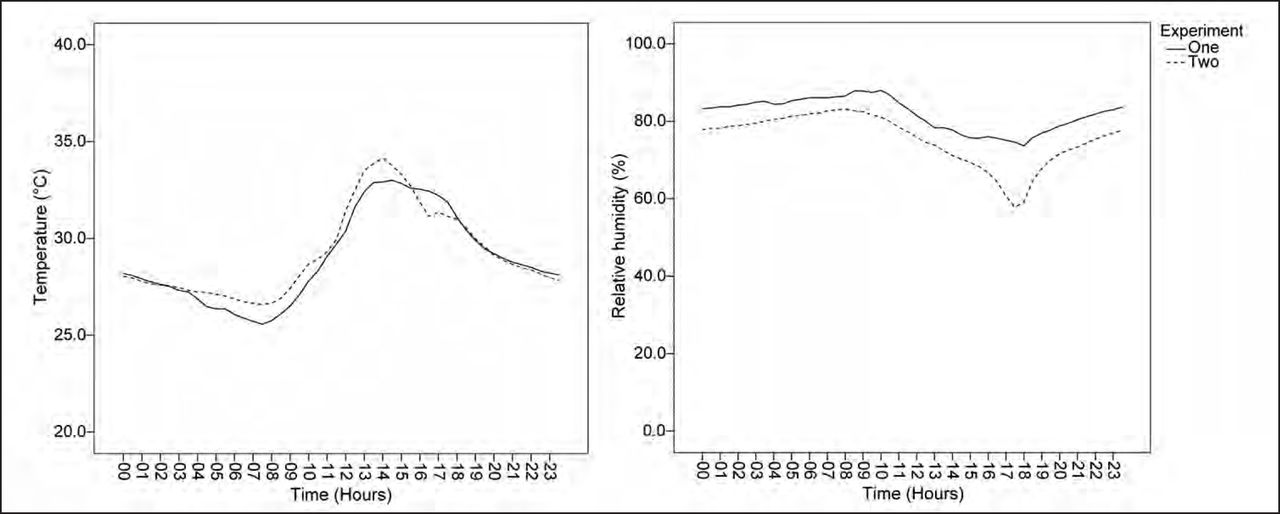
Average diurnal variation in temperature (°C) and relative humidity (%) during the two experimental periods, lasting four days each, was typical for equatorial climatic conditions in Singapore. Experiment one was conducted between June 15–18 and experiment two between August 10–13, 2011. Note: error bars (± SD) illustrate the observed variability in environmental parameters at regular intervals.
- Figure 5.
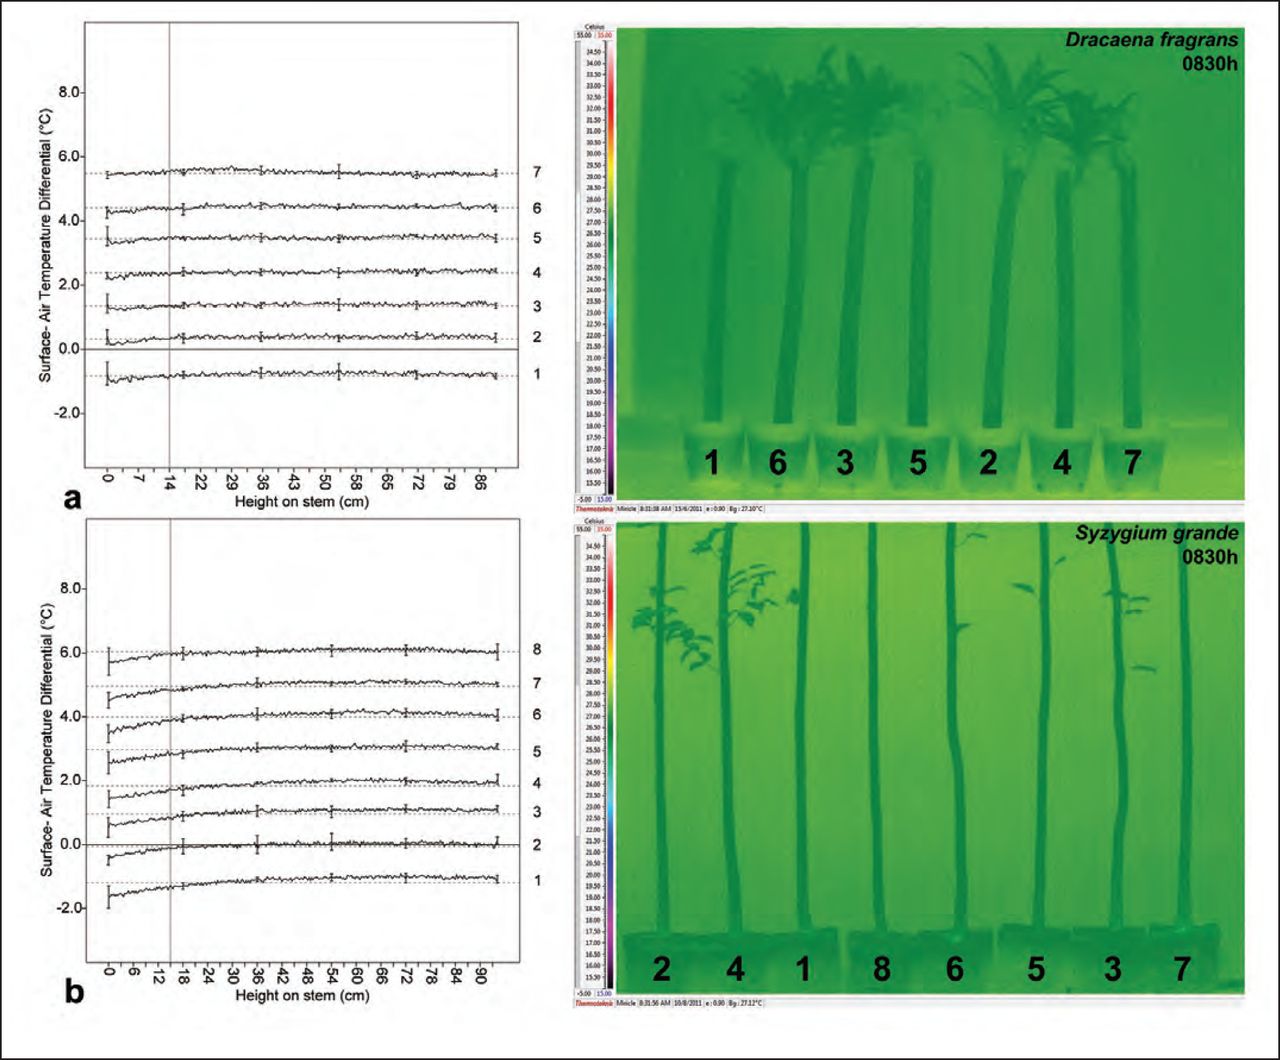
IR images taken in the morning revealed homogenous stem temperature distributions among all plants in both experiments; this was corroborated by the relatively uniform linear temperature trends for each treatment plotted in the coordinate plane. In the line graph, each treatment’s values were offset consistently by +1°C greater than the preceding treatment’s to avoid overlapping lines in the coordinate plane. Note: The dashed horizontal reference lines show the modified treatment mean surface-air temperature differential, vertical reference line denotes the purposefully selected reference point, solid zero line represents the point at which unmodified treatment surface temperatures and ambient temperatures are identical, and the error bars (± SD) illustrate the observed variability in surface temperature at regular intervals.
- Figure 6.
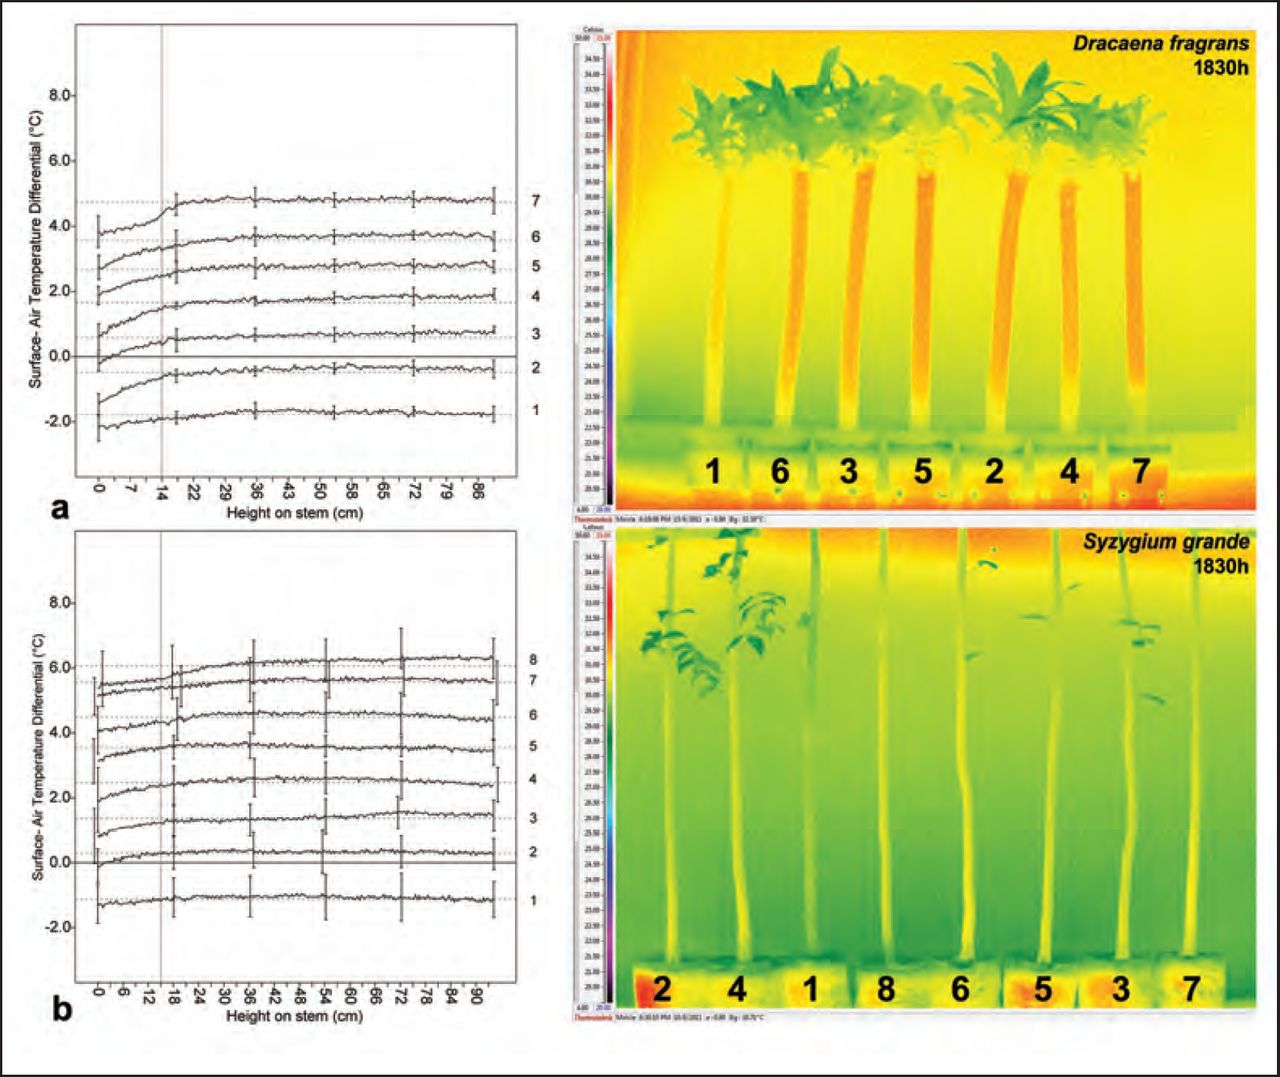
IR images taken in the evening revealed abnormal temperature reductions near the 3.8 cm internal void position in both experiments. Basal temperature gradients of progressively cooler temperatures were observed on all plants except one, the non-irrigated control, which presented a comparably cool, vertically homogenous temperature distribution. These observations were supported by a sharp deviation in the linear temperature trend near the 3.8 cm voids and the relatively flat trend line for the non-irrigated control, respectively. In the line graph, each treatment’s values were offset consistently by +1°C greater than the preceding treatment’s to avoid overlapping lines in the coordinate plane. Note: The dashed horizontal reference lines show the modified treatment mean surface- air temperature differential, vertical reference line denotes the purposefully selected reference point, solid zero line represents the point at which unmodified treatment surface temperatures and ambient temperatures are identical, and the error bars (± SD) illustrate the observed variability in surface temperature at regular intervals.


Tables
- Table 1.
Physical characteristics of mechanically induced voids in Dracaena fragrans and Syzygium grande stems.
Experiment Treatment Characteristics of void Diameter (cm) Height above soil (cm) Relative cross-sectional area (%) Volume (cm3) Set 1 1 0.0 0.0 0.0 0.0 D. fragrans 2 0.0 0.0 0.0 0.0 3 1.2 30.0 25 33.9 4 2.5 25.0 50 122.7 5 2.5 30.0 50 147.3 6 2.5 35.0 50 171.8 7 3.8 30.0 76 340.2 Set 2 1 0.0 0.0 0.0 0.0 S. grande 2 0.0 0.0 0.0 0.0 3 1.2 15.0 25 17.0 4 2.5 15.0 50 73.6 5 3.2 5.0 65 40.2 6 3.2 10.0 65 80.4 7 3.2 15.0 65 120.6 8 3.8 15.0 76 170.0 - Table 2.
Localized stem temperature deviation from the mean surface temperature in linear temperature plots.
Set 1: Dracaena fragransz Set 2: Syzygium grandez Time Time 0830h 1830h 0830h 1830h Treatment Deviation from linear trend (°C) Deviation from linear trend (°C) Mean ± SD P-value Mean ± SD P-value Mean ± SD P-value Mean ± SD P-value 1 0.11 ± 0.07 0.361 0.17 ± 0.07 0.588 0.14 ± 0.09 0.389 0.03 ± 0.11 0.851 2 0.06 ± 0.09 − 0.21 ± 0.04 − 0.09 ± 0.08 − 0.04 ± 0.06 − 3 0.05 ± 0.07 0.908 0.15 ± 0.02 0.751 0.10 ± 0.09 0.878 −0.01 ± 0.01 0.551 4 0.04 ± 0.06 0.728 0.28 ± 0.04 0.162 0.12 ± 0.08 0.575 0.08 ± 0.13 0.736 5 0.05 ± 0.10 0.908 0.19 ± 0.07 0.821 0.08 ± 0.09 0.918 −0.04 ± 0.17 0.355 6 0.04 ± 0.01 0.728 0.27 ± 0.15 0.188 0.14 ± 0.02 0.446 0.05 ± 0.03 1.000 7 0.00 ± 0.07 0.306 0.51 ± 0.14 0.001y 0.10 ± 0.08 0.878 0.14 ± 0.04 0.337 8 − − − − 0.12 ± 0.09 0.646 0.34 ± 0.16 0.004y Set 1: Dracaena fragransz Time Time 0830h 1830h 0830h 1830h Treatment Surface-air temperature differential (°C) Standard deviation (°C) Mean ± SD P-value Mean ± SD P-value Mean ± SD P-value Mean ± SD P-value 1 −0.35 ± 0.07 0.253 −1.64 ± 0.29 0.821 0.24 ± 0.13 0.514 0.23 ± 0.03 0.061 2 −0.23 ± 0.08 − −1.58 ± 0.22 − 0.20 ± 0.07 − 0.29 ± 0.05 − 3 −0.19 ± 0.06 0.728 −1.41 ± 0.22 0.466 0.16 ± 0.06 0.615 0.24 ± 0.04 0.112 4 −0.19 ± 0.06 0.752 −1.49 ± 0.24 0.693 0.16 ± 0.05 0.547 0.27 ± 0.05 0.509 5 −0.11 ± 0.10 0.278 −1.33 ± 0.30 0.286 0.14 ± 0.01 0.370 0.22 ± 0.03 0.032y 6 −0.13 ± 0.09 0.382 −1.50 ± 0.26 0.714 0.25 ± 0.13 0.453 0.23 ± 0.04 0.050y 7 −0.13 ± 0.27 0.382 −1.62 ± 0.41 0.888 0.14 ± 0.02 0.424 0.17 ± 0.02 0.001y Mean temperature (°C) Skewness (sk) 1 25.60 ± 1.72 0.931 30.16 ± 0.93 0.942 1.79 ± 1.23 0.810 −0.86 ± 0.02 0.001y 2 25.73 ± 1.74 − 30.21 ± 0.91 − 1.58 ± 1.38 − −0.23 ± 0.21 − 3 25.76 ± 1.72 0.980 30.39 ± 0.91 0.814 0.70 ± 1.15 0.322 −0.26 ± 0.08 0.854 4 25.76 ± 1.74 0.981 30.31 ± 0.88 0.899 0.58 ± 0.94 0.260 −0.14 ± 0.14 0.507 5 25.84 ± 1.76 0.935 30.47 ± 0.87 0.728 0.44 ± 0.36 0.203 −0.25 ± 0.14 0.890 6 25.82 ± 1.69 0.948 30.30 ± 0.89 0.906 2.02 ± 1.35 0.618 −0.26 ± 0.34 0.836 7 25.82 ± 1.70 0.948 30.18 ± 0.82 0.964 0.21 ± 0.38 0.131 0.06 ± 0.10 0.058 Set 2: Syzygium grandez Treatment Surface-air temperature differential (°C) Standard deviation (°C) 1 −0.61 ± 0.22 0.147 −0.92 ± 0.42 0.258 0.17 ± 0.02 0.327 0.26 ± 0.07 0.311 2 −0.78 ± 0.07 − −0.32 ± 0.51 − 0.22 ± 0.06 − 0.22 ± 0.01 − 3 −0.61 ± 0.15 0.147 −0.25 ± 0.66 0.893 0.21 ± 0.04 0.818 0.16 ± 0.03 0.078 4 −0.76 ± 0.09 0.881 −0.51 ± 0.89 0.720 0.19 ± 0.05 0.594 0.24 ± 0.01 0.608 5 −0.65 ± 0.10 0.252 −0.05 ± 0.34 0.605 0.19 ± 0.07 0.594 0.29 ± 0.06 0.053 6 −0.61 ± 0.11 0.133 −0.22 ± 0.68 0.843 0.20 ± 0.07 0.702 0.27 ± 0.03 0.193 7 −0.64 ± 0.06 0.219 −0.19 ± 0.55 0.803 0.20 ± 0.04 0.760 0.22 ± 0.02 1.000 8 −0.58 ± 0.19 0.082 −0.81 ± 0.78 0.353 0.19 ± 0.06 0.494 0.30 ± 0.04 0.023y Mean temperature (°C) Skewness (sk) 1 25.47 ± 1.76 0.907 28.85 ± 0.65 0.260 −0.12 ± 0.43 0.543 −0.75 ± 0.20 0.046y 2 25.30 ± 1.73 − 29.45 ± 0.71 − 0.20 ± 0.87 − −1.32 ± 0.38 − 3 25.47 ± 1.67 0.907 29.52 ± 0.55 0.893 0.66 ± 1.24 0.374 −0.28 ± 0.10 0.001y 4 25.32 ± 1.72 0.991 29.26 ± 0.13 0.721 −0.29 ± 0.21 0.351 −0.93 ± 0.37 0.156 5 25.43 ± 1.69 0.927 29.72 ± 0.68 0.607 −0.25 ± 0.22 0.397 −1.14 ± 0.64 0.509 6 25.48 ± 1.76 0.903 29.55 ± 0.82 0.843 −0.39 ± 0.47 0.269 −0.39 ± 0.03 0.003y 7 25.44 ± 1.78 0.922 29.58 ± 0.82 0.804 −0.27 ± 0.28 0.374 −0.38 ± 0.23 0.003y 8 25.51 ± 1.61 0.886 28.96 ± 0.35 0.355 0.12 ± 0.50 0.887 0.05 ± 0.24 0.000y


Jump to section
Related Articles
Cited By...
- No citing articles found.