
Abstract
The effect of irrigation on the growth of container-grown oaks was investigated over a 4-year period. Quercus lobata, Q. agrifolia, and Q. douglasii were irrigated at three levels of reference evapotranspiration (0, 0.25, and 0.5 ET0) after being established for 1 year at the University of California Bay Area Research and Extension Center in Santa Clara, California, U.S. Although no significant differences were found in trunk diameter growth for irrigation treatments after 4 years, growth of Q. agrifolia was significantly greater than Q. lobata and Q. douglasii. Root mass, shoot mass, and root distribution were measured for Q. agrifolia, and mean shoot:root ratio was found to be 2.6 to 1. Many roots of Q. agrifolia were found to develop with a stronger vertical than horizontal orientation, and root distribution was not significantly affected by irrigation treatments.
Although native oaks are considered highly desirable species in California, U.S., oak populations have declined in both wildland and urban areas over the past century (Pavlik et al. 1992). In wildland areas, substantial efforts have been made to restore populations, and new stands have been established in the past 20 years (McCreary 1993, 2001; Swiecki and Bernhardt 1993; Standiford 1999). In urban areas, however, many mature oaks have declined or been removed to make room for residential or commercial developments and replaced with non-native species.
Native oaks are often replaced with non-native species because native oaks have been characterized as being slow-growing: they are viewed as requiring much more time to achieve a desirable size than “fast-growing” landscape species. This characterization likely resulted from observations of oaks in their native habitat and may not be an accurate assessment of their actual performance in urban landscapes. Because many urban landscapes in California are irrigated, and the growth rate of many woody species is enhanced by irrigation, it was hypothesized that the growth rate of native oaks also may be enhanced by irrigation.
Previous reports have provided evidence of a positive response of Quercus spp. to irrigation during the establishment period. In a study evaluating irrigation volume and frequency on the establishment of container-grown Q. virginiana, Gilman et al. (1998) reported that frequent irrigation during the first growing season after transplanting (76 L [20 gal] every day for 6 months) promoted greater survival and establishment than infrequent irrigation (76 L [20 gal] every 2 or 3 days for 3 months) for southern live oak planted in a sandy soil in Florida. It was noted that “it was more important to irrigate transplanted trees frequently that it was to apply a large volume of water.” In a follow-up study evaluating nursery production methods, irrigation, and inoculation with mycorrhizae-forming fungi on the establishment of Q. virginiana, Gilman (2001) found that irrigation during the first summer after transplanting resulted in higher survival rates for all nursery production types tested (container- and field-grown stock). During the irrigation treatment period (for 6 months after transplanting), trunk diameter growth rate for all nursery production types was greater for irrigated than for nonirrigated trees. In the 2-year period following the cessation of irrigation, however, trunk diameter growth rate was equivalent whether trees were initially irrigated or not. These results provide evidence that irrigation during the first year after transplanting can have a measurable and positive effect on the survival and growth of transplanted container- and field-grown trees.
Although previous studies support the need for irrigation during the first year after transplanting for southern live oak, irrigation effects on the growth of California native oaks (Quercus spp.) following a 1-year establishment period have not been evaluated. This study was conducted to (1) evaluate the influence of irrigation volume on trunk diameter growth of three California oak species over a 4-year period, (2) quantify differences in irrigation response among species, and (3) describe root distribution and quantify shoot:root ratio for coast live oak (Q. agrifolia).
METHODS
This study was conducted at the University of California Bay Area Research and Extension Center (BAREC) in Santa Clara, California, from spring 1997 to fall 2001. Prior to planting, a field plot measuring 33 m (100 ft) wide and 41 m (125 ft) long was cultivated approximately 0.82 m (2.5 ft) deep to create uniform root zone soil conditions. Soil analysis indicated that soil pH (6.8) and salt content (electrical conductivity = 0.91 dS/m) were not limiting (Craul 1999). Soil texture was classified as loam (47% sand, 38% silt, and 15% clay), and mean bulk density was 1.48 g/cc (range = 1.41 to 1.59 g/cc) for three depths (0.33, 1, and 2 m [1, 3, and 6 ft]) and three locations across the plot. Growth-limiting bulk density for loam is approximately 1.6 g/cc (Daddow and Warrington 1983).
Acorn-propagated container stock (19 L [5 gal]) of three species of California native oak were selected for uniformity of size, health, and vigor from nurseries in the San Francisco Bay area. Species included Quercus lobata (valley oak), Q. agrifolia (coast live oak), and Q. douglasii (blue oak). At planting (March 1997), soil was loosened by hand from the root ball, peripheral roots were spread in the planting hole, and the top of the root ball was set approximately 2.5 cm (1 in.) above the soil line. After backfilling with plot soil, berms were formed to create watering basins, and all plants were hand-watered twice a week (approximately 11.4 L [3 gal] per tree per irrigation) for 3 months after planting. Neither fertilizer nor mulch was applied. Weeds were controlled by mowing and applications of glyphosate (as needed). Average annual rainfall at BAREC is 40 cm (16 in.).
Trees were spaced on 3.3 m (10 ft) centers. Randomized complete blocks were established with three irrigation treatments for each species per block. Eight replicates for each treatment and species gave a total of 72 trees in the study plot.
Irrigation treatments were established as fractions of reference evapotranspiration (ET0): 0.25 ET0, 0.5 ET0, and 0 (no irrigation). ET0 was measured from a California Irrigation Management Information System (CIMIS) station located adjacent to the study plot. Average monthly ET0 for the period May through August is 16.5 cm (6.5 in.), with a range of 14.5 to 18 cm (5.7 to 7.1 in.). After the 3-month period of hand watering, all plants received 1 ET0, applied twice weekly using a drip irrigation system. This irrigation program during the first season ensured the survival of all trees and allowed for a root establishment period. Irrigation treatments were initiated in the second year (1998) and continued for 3 years.
The specific amount of water delivered to 0.25 and 0.5 ET0 treatment trees was determined from a measure of average crown projection (ground shading) by individual plants (Lindsey and Bassuk 1991; Costello and Jones 2000). Using a 50 cm (20 in.) diameter for crown projection, plants initially shaded an area of 2 m2(21.5 ft2). Being small plants, leaf area index (LAI) was set at 1. For this area, 5.1 L (1.35 gal) of water was needed to supply 2.5 cm (1 in.) of water (1 ft2-inch volume of water = 0.62 gal). On average, 0.25 ET0 treatments received 13.3 L (3.5 gal) per week and 0.5 ET0treatments received 26.6 L (7 gal) per week.
Irrigation water was supplied using a Netafim Techline pressure-compensating drip system (1.27 cm [0.5 in.] polyethylene tubing). In-line emitters were placed in a circle within the canopy perimeter (drip line) of each tree, with four emitters per tree. In 1999, an additional line of emitters was added to the outside of the original line to provide water to the enlarging root system. Each emitter supplied 3.8 L (1 gal) per hour. To monitor total water supplied to all plants in each irrigation treatment, flow meters (Neptune® 1.6 cm [0.63 in.]) were installed in each main line. This provided assurance that 0.5 ET0 treatments were actually receiving two times the amount of water of 0.25 ET0 treatments. Water supply was controlled with a six-station irrigation timer (Hardie Rain Dial®), set to irrigate 0.25 and 0.5 ET0 treatments once and twice per week, respectively. Watermark® soil moisture sensors (Irrometer Corp., Riverside, CA) were installed 15.3 and 30.5 cm (6 and 12 in.) deep within the irrigated zone of plants (approximately one-half the distance between in-line emitters and plants) at seven locations across the plot. Sensors were used to monitor water application uniformity and assess moisture depletion between irrigations. Periodic measurements of water applied by emitters to each tree and the use of flow meters to monitor total water applied to treatments substantiated that water supply and distribution were in agreement with scheduled amounts.
Trunk diameter was measured annually for all trees at 15.3 cm (6 in.) above ground line. Although plant height was recorded, it was not used to assess treatment effects due to variability in tree form. In summer 2001, root systems of coast live oak were excavated to quantify root mass and distribution (Figure 1). Three trees from each irrigation treatment were measured. Trenches were dug 2 m (6 ft) deep and 1.6 m (5 ft) from the trunk on two or three sides of excavation trees using a backhoe. Trenches were used as a receptacle for soil removed from roots. An area 2.6 × 2.6 m (8 × 8 ft) around each tree was excavated to a 1.6 m (5 ft) depth using a pneumatic tool (Air-Spade®). In some cases, individual roots were excavated beyond this volume to their length and depth (to 2 mm [0.08 in.] diameter). Based on a visual assessment after excavations, it was estimated that less than 5% of roots remained unexcavated.

After 4 years, root systems of coast live oak were fully excavated using a pneumatic excavation tool (Air-Spade®), backhoe, and jackhammer.
Following excavation, intact root systems were removed from the field, suspended from a greenhouse roof beam, and leveled with elastic ties (to establish ground line) for measurement. Roots were found to be sufficiently rigid such that they maintained their position relative to one another when suspended. The diameter of all roots at 15, 60, and 122 cm (6, 24, and 48 in.) depths was measured, and their distance from the root system center point (a vertical axis extending down from the trunk) was recorded. This provided an assessment of the amount of root mass at each depth and lateral distance from the trunk. All diameter measurements at each of three depths (15, 60, and 122 cm [6, 24, and 48 in.]) and for four distance ranges (0 to 30, 31 to 61, 62 to 91, and 92 to 122 cm [0 to 12, 13 to 24, 25 to 36, and 37 to 48 in.]) were summed to give a cumulative root diameter (crd). The crd value was used to assess irrigation treatment effects on root distribution.
Trunk diameter data were analyzed using a two-way ANOVA (randomized complete block design) with species and irrigation as factors, each at three levels. Means were separated using Fisher’s protected LSD test at P ≤ 0.05. For irrigation and root distribution, a repeated measures design was used with three treatment levels (irrigation volume) compared at four distances from the trunk and three levels of depth. For coast live oak (Q. agrifolia) root measurements, three trees were used for each irrigation treatment level. The data were analyzed using SAS Proc Mixed with fixed effects irrigation, depth and distance, and random effect tree. The analysis was carried out on the log transform of the original measurements. Residual plots were examined for any model violations.
To determine the shoot:root ratio for coast live oak (Q. agrifolia), root systems and shoots (trunk, branches, and leaves) were air dried for 2 months and then weighed. Sample wood sections from roots and trunks were weighed fresh, oven dried, and weighed again to assess moisture content of air-dried samples. To establish an initial shoot:root ratio for container stock, six plants (not used in the field plot) were selected. After soil was washed from the root ball, roots and shoots were sectioned, dried, and weighed.
RESULTS AND DISCUSSION
All trees survived and grew for the duration of the study. Blue oaks were affected by powdery mildew during the summer months, but no trees were damaged severely. Irrigation treatment effects on trunk diameter are reported for all species, while shoot and root weights, shoot:root ratio, and root distribution are reported for coast live oak only.
Trunk Diameter
Trunk diameter growth was significantly greater for coast live oak than for valley oak or blue oak (Table 1). Valley oak growth was significantly greater than blue oak in all years except the first year after planting. Trunk diameter in 2001 was 11-fold greater than that in 1997 for coast live oak, 7.5-fold greater for valley oak, and 4.5-fold greater for blue oak. Mean annual increment of diameter growth was 33 mm/yr (1.3 in./yr) for coast live oak, 18.4 mm/yr (0.72 in./yr) for valley oak, and 9.3 mm/yr (0.37 in./yr) for blue oak.
Mean trunk diameter of coast live oak (Quercus agrifolia), valley oak (Q. lobata), and blue oak (Q. douglasii) from 1997 to 2001 for three irrigation treatments (0 ET0, 0.25 ET0, and 0.5 ET0), and mean height in 2001.
For all species, no significant differences in mean trunk diameter resulted from irrigation treatments for the 4-year duration of this study (Table 1). This finding is consistent with results reported by Gilman et al. (2002), indicating that irrigation volume had no effect on trunk caliper and tree height of southern live oak grown in a sandy soil over a 3-year period. In addition, a concurrent study evaluating irrigation effects on acorn stock of coast live oak, valley oak, and blue oak found no significant irrigation effects on trunk diameter growth during any year of the 4-year study (McCreary et al. 2002).
Although our findings indicate that irrigation did not produce an increase in tree growth, it needs to be emphasized that these results are linked to site and study conditions; therefore, similar results may not be found in soils that have low moisture status during the first year after planting or in soils that limit root development (chemically or physically).
Tree Height
After 4 years, average height of valley oak was 3.9 m (12 ft), while that of coast live oak was 3.6 m (11 ft), and blue oak was 2.3 m (7 ft) (Table 1). Because height is not a good measure of plant growth, however, treatment effects were not analyzed statistically.
Shoot:Root Ratio
Mean shoot:root ratio (across irrigation treatments) for coast live oak (calculated from dry weights) was 2.6:1, with a range from 2.3:1 to 3.1:1 (Table 2). Similarly, the shoot:root ratio for container plants measured prior to field planting was found to be 2.6:1 (Table 2). Although there was no significant difference in shoot:root ratio between 0 and 0.25 ET0 treatments, a significantly higher ratio was found for the 0.5 ET0 treatment.
Mean weight of shoots and roots (kg), and shoot:root ratios for coast live oak (Quercus agrifolia) for three irrigation treatments (0 ET0, 0.25 ET0, and 0.5 ET0) after 4 years and prior to planting (pre-plant).
The mean shoot:root ratio for coast live oak indicates that this species partitions 2.6 times more biomass in the shoots than in the roots (on average). By comparison, Harris (1992), citing other reports, surmised that the shoot:root ratio for most trees under normal conditions ranged from 5:1 to 6:1. However, Burger et al. (1997) reported shoot:root ratios ranging from 0.4 to 4.1 for seven tree species grown in the field for 2 years: Lagerstroemia indica (0.4), Ginkgo biloba (0.68), Quercus lobata (2.03), Fraxinus latifolia (2.23), Sequoia sempervirens (2.78), Platanus racemosa (3.9), and Quercus agrifolia (4.1). Although other factors affect shoot:root ratios (e.g., soil physical and chemical properties), species is clearly an important determinant.
Notably, the average shoot:root ratio did not change from the initial ratio measured for container stock (2.6:1). Considering the potential for restriction in root development in containers (largely due to container size), the shoot:root ratio may be expected to increase after field planting. However, this finding suggests that little or no change in biomass partitioning (between shoots and roots) occurred in the 4 years after planting. It is possible, however, that root development initially was not limited by container size in this study and, accordingly, growth relationships between shoots and roots were not impacted.
Root Distribution
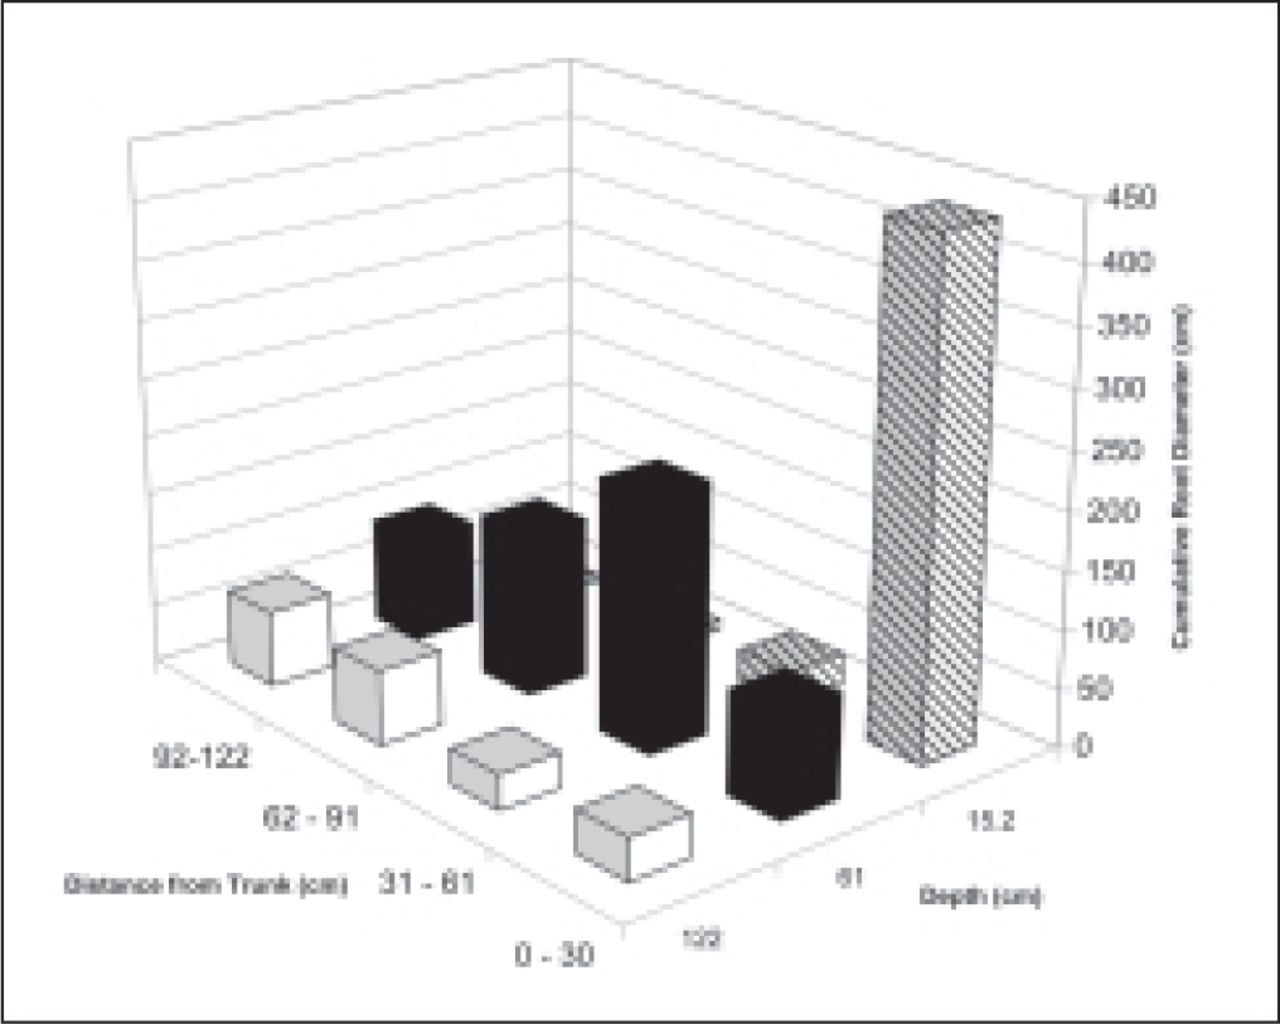
Root distribution patterns were not significantly different for irrigation treatments. Significant interactions across irrigation treatments were found for cumulative root diameter (crd) at distance intervals from the trunk and at soil depths (Figure 2). At the distance interval closest to the trunk (0 to 30 cm [0 to 12]), crd was significantly greater at 15.2 cm (6 in.) than at 61 and 122 cm (24 and 48 in.). At the 31 to 61 cm (13 to 24 in.) distance interval, crd was significantly greater at the 61 cm (24 in.) depth than at 15.2 or 122 cm (6 or 48 in.). Moving farther from the trunk, crd continued to be significantly greater at 61 cm (24 in.) than at 15.2 or 122 cm (6 or 48 in.) depths. At the farthest distance interval (92 to 122 cm [37 to 48 in.]), crd was significantly greater at 61 cm (24 in.) than at 15.2 cm (6 in.), but the difference between 61 and 122 cm (24 and 48 in.) depths was not significant. At the 15.2 cm (6 in.) depth, very few roots were found in the distance intervals from 62 to 122 cm (25 to 48 in.). At 61 and 122 cm (24 and 48 in.) depths, however, roots were found at all distances from the trunk.

Cumulative root diameter (crd) for coast live oak (Quercus agrifolia) at three depths and four distances from the trunk. Values are means for three irrigation treatments combined. At 15.2 cm (6 in.) depth, crd was greater closer to the trunk (0 to 30 cm [0 to 12 in.]) than at distances farther from the trunk (31 to 122 cm [13 to 48 in.]). At 61 cm [24 in.], crd was greatest at intermediate distances from the trunk (31 to 61 cm [13 to 24 in.] and 62 to 91 cm [25 to 36 in.]). At 122 cm (48 in.) depth, increases in crd were found at distances farther from the trunk (62 to 91 cm [25 to 36 in.] and 92 to 122 cm [37 to 48 in.]) than closer to the trunk (0 to 30 cm [0 to 12 in.] and 31 to 61 cm [13 to 24 in.]).
Although roots were found at all angles between the horizontal and vertical planes, root distribution measurements indicate that coast live oak developed roots with a stronger vertical than horizontal orientation. Although root distribution can vary with soil conditions, previous reports have described a largely horizontal orientation for tree root systems (Perry 1982; Wilson 1984). Here, results suggest that coast live oak has the potential to develop a root system with a strong vertical component.
Root depth and distance were found to be independent of irrigation treatments: the application of irrigation water did not substantially change root distribution. This result suggests that the root distribution pattern for coast live oak became established largely during the first year after planting. Although root diameter and extension growth continued in subsequent years, root distribution at depth did not change after the first year.
CONCLUSION
In summary, irrigation did not enhance trunk diameter growth of coast live oak, valley oak, or blue oak. After a 1-year establishment period, each of these species was found to grow at the same rate with or without irrigation. Trunk diameter growth was significantly different for the three oak species, with coast live oak being largest, followed by valley oak and blue oak. Coast live oak was found to apportion approximately 2.6 times more biomass to shoots than roots (on average), and increasing irrigation volume resulted in a significant increase in shoot:root ratio. Roots of coast live oak developed a stronger vertical than horizontal orientation, and root distribution patterns did not change in response to irrigation treatments.
Acknowledgments
The authors gratefully acknowledge the E.J. Slosson Endowment for grant support. We thank Zac Mousli, Leo Dumont, and Santiago Aldana (BAREC) for assistance in installing and maintaining the research plot; Tom Bressan, Urban Farmer Store, San Francisco, California, for irrigation system design; and Carol Adams and Christiana Drake (University of California, Davis) for statistical support.
- © 2005, International Society of Arboriculture. All rights reserved.


Jump to section
Related Articles
Cited By...
- No citing articles found.