
Abstract
This paper reports application of electric, ultrasonic, and georadar tomography for detection of decay in trees and their comparison with the traditional penetrometer. Their feasibility in arboriculture is also evaluated, critically considering some “open problems.” The experiments were carried out in an urban environment on two plane (Platanus hybrida Brot.) trees. Both trees, after felling, showed extensive white rot in the central cylinder. The electric tomography revealed low resistivity zones roughly centered in the trunk. A comparison with the successively cut sections showed a fine correspondence to decayed areas and a strong correspondence between high moisture zones and low resistivity zones. Ultrasonic tomography demonstrated to be a very effective tool for the detection of internal decay, accurately locating the position of the anomalies and estimating their size, shape, and characteristic in terms of mechanical properties. With the georadar technique, the high contrast of electromagnetic impedance measured between the inner decayed section and the outside sound section allowed the detection of the interface between the sound and decayed section of the tree, using radar acquisition in reflection modality. The penetrometer profiles detected the low-resistance areas inside the two trunks.
The field guide for the visual tree assessment method (VTA) (Mattheck and Breloer 1994) suggests three different tools for detection and quantification of internal defects in trees: a sound impulse hammer, a penetrometer, and a fractometer. The visual tree inspection and its instrumental approach represented, without any doubt, a qualitative leap compared to the old and simple analysis made with the increment borer; in the meantime, the wide, practical use of VTA supported a strong interest in developing and applying more rapid and precise diagnostic techniques to detect defects in wood.
The methods for noninvasive evaluation analyze physical and chemical properties of wood: density (Beall 1996; Sandoz 1996; Bucur and Rasolofosaon 1998; Bucur 1999), electrical resistivity (Dubbel et al. 1999; Weihs et al. 1999), modulus of elasticity (Bucur 1995; Ross et al. 1997; Berndt et al. 1999), ionic concentration and moisture content (Zoughi 1990; Smith and Ostrofsky 1993). In recent years, there has been an evolution of the instruments applying the aforementioned techniques (Nicolotti and Miglietta 1998), often developed for engineering or medical applications, such as penetrometers, electrical conductivity meters, ultrasonic detectors, x-rays, and γ-ray densimeters (Bucur 1985; Adjanohoun et al. 1999; Oja 1999) and nuclear magnetic resonance (Pearce et al. 1997). Most of the instruments designed for the investigation of timber, woody structures, and wood-based materials are known as “noninvasive” even if it would be more appropriate to call them “quasi-noninvasive” because, in many cases, probes, electrodes, transducers, etc. are inserted into the wood. Besides, these instruments provide local information influenced by undefined portions of the material surrounding the sensors. For this reason, when applied on the trunks for wood decay detection, it might be better to take measurements in different points to have more information about the investigated section, even if doing so may take longer.
Not by chance, some of these techniques have been recently developed for tomographic investigation. Tomography (from Greek tomos, slice) allows the reconstruction of a cross section through an object by means of measurements performed on the object surface and measuring energy that passes through the object itself (Worthington 1984; Nolet 1987; Stewart 1991). Different types of energy can supply information about different physical properties of the investigated object: Ultrasonic waves provide information on elastic properties of wood; electric fields and radar frequency electromagnetic waves provide information on conductivity (moisture content and ionic concentration); and γ-rays and x-rays give information on wood density.
Several studies regard tomographic techniques; most of them are on timber and woody structures. Ultrasonic tomography has been applied by Tomikawa et al. (1990) and Biagi et al. (1994) for investigation of poles and timber and by Comino et al. (2000b) on living trees; Dubbel et al. (1999), Weihs et al. (1999), and Comino et al. (2000a) carried out many experiments of electric tomography on living trees; Rust and Göcke (2000) applied sonic tomography on trees; Temnerud and Oja (1998) and Guddanti and Chang (1998) tested x-ray CT (computed tomography) on logs, and Rust (1999) used it on living Scots pines (Pinus sylvestris), while tomodensitometry was applied by ³-rays on wood by Chambellan et al. (1994).
Fewer applications on living trees are reported, particularly with reference to ultrasonic waves, electromagnetic waves (Miller and Doolittle 1990; Godio et al., 2000), and electric fields. In fact, there are some “open problems” with the noninvasive tomographic approach on trees.
With regard to ultrasonic measurements, the main problems are the coupling of the transducers to the bark, the anisotropy of wood, the signal attenuation that could prevent an accurate travel time reading, and the spatial resolution.
With regard to radar frequency electromagnetic waves, the main problems are the coupling of the antennas to the bark, the difficulty of data interpretation, and the signal attenuation due to its high frequency. Nevertheless, high frequency is necessary for a good spatial resolution.
With regard to the electric fields, the main problems are related to high resistivity of the bark, which could prevent the current flow and a reliable voltage measurement.
This paper reports application of electric, ultrasonic, and georadar tomography for detection of decay in trees and their comparison with the traditional penetrometer. Their feasibility in arboriculture is also evaluated, critically considering all the aforesaid “open problems.”
MATERIALS AND METHODS
The experiments were carried out in an urban environment on two plane trees (Platanus hybrida Brot.) that were going to be cut down. On the two trees, referred to as A and B, both tomographic measurements and penetrometric tests were performed on the trunk sections at 40 and 100 cm, respectively, from ground level. After field tests were performed, the trees were cut down and 30 cm wood disks, corresponding to the investigated sections, were extracted, put in a plastic bag, and stored in the refrigerator at 5°C. Within 24 h, all the measurements were repeated on the four wood disks in the laboratory in order to compare the results with those obtained directly on the trees.
From the wood disks, cubic samples (50 × 50 × 50 mm) were later extracted according to the scheme shown in Figure 1, in order to measure or infer some physical properties, such as moisture content, density, porosity, saturation, mass loss, and dielectric constant, that could be correlated with the data obtained by tomographic and penetrometric field tests.

(a) In situ tomography; (b) in-lab tomography; (c) samples extracted to determine physical properties of wood.
The aforementioned parameters were measured on fresh wood, and the values obtained were used to reconstruct maps of the parameter distribution within each investigated section.
Porosity, saturation, and dielectric constant were estimated as follows:
Porosity Φ = Vva/Vpf
Vpf = apparent volume of the fresh samples (product of the three dimensions of each fresh sample)
Vva = volume of anhydrous voids = Vpf – (Mpa/Dpc) Mpa = dry mass
Dpc = density of the cell walls = 1.5 g/cm3 (Giordano 1981)
Saturation, Sw = Vf/Vva (the fluid volume Vf was obtained from the water mass in each sample, calculated by subtracting the dry mass from the fresh one) Dielectric constant (Epsilon) 
Φ = porosity
εla = dielectric constant of dry wood (= 4)
Sw = saturation
εw = water dielectric constant (= 81)
Sa = air dielectric constant (= 1)
Electric Tomography
Electric tomography allows the user to obtain an image of the resistivity distribution on a section of a tree. The variation of resistivity values are the result of different types of wood and the changes provoked by the rot decays (Shortle 1982). During the degradation processes, the fungi release a noticeable quantity of ions. Ionization mechanisms are substantially two: Brown rot increases acidity by releasing H-ions, which causes a lowering of wood resistivity; white rot, on the other hand, causes an accumulation of cations and K-ions that, thanks to their high mobility, produce a lowering of the wood resistivity even from the very beginning of the decaying process (Tattar and Shigo 1972; Tattar and Saufley 1973; Shortle and Smith 1987) and an increase of the dielectric constant values (Blanchard and Tattar 1974; Anagnostopoulou-Konsta and Pissis 1988). The resistivity is moreover influenced by wood porosity and texture, which are also modified by the fungi decaying action (Skaar 1988).
Data Acquisition and Processing
Field measurements on the two plane trees were made with a STING R1 geo-resistivimeter (Advanced Geoscience, Inc., Austin, TX, US). The electrodes were made by 5 cm long steel nails, laterally coated by an insulating film so that only the tip was electrically conductive.
Sixteen equidistant electrodes (driven to a depth of 1 cm) were used with an energizing and reading scheme like the one shown in Figure 2. The use of two diametrically opposite electrodes as current electrodes ensured effective, energizing, and reliable potential readings: current immission between each pair of opposite electrodes and potential reading among all the other electrodes, according to the scheme shown in Figure 2. By the proposed scheme, 96 independent measures were obtained within each wood disk. The collected values of current and potential, together with the geometry of electrodes layout, were then used as input of an inversion software implemented in Matlab© and based on a “quasi-Newton” algorithm that was estimated to be the most suitable in terms of CPU-time consumption and error propagation (Loke and Barker 1996). As a final result, an adimensional, normalized resistivity map of the trunk section contained in the perimeter described by the electrodes was obtained.
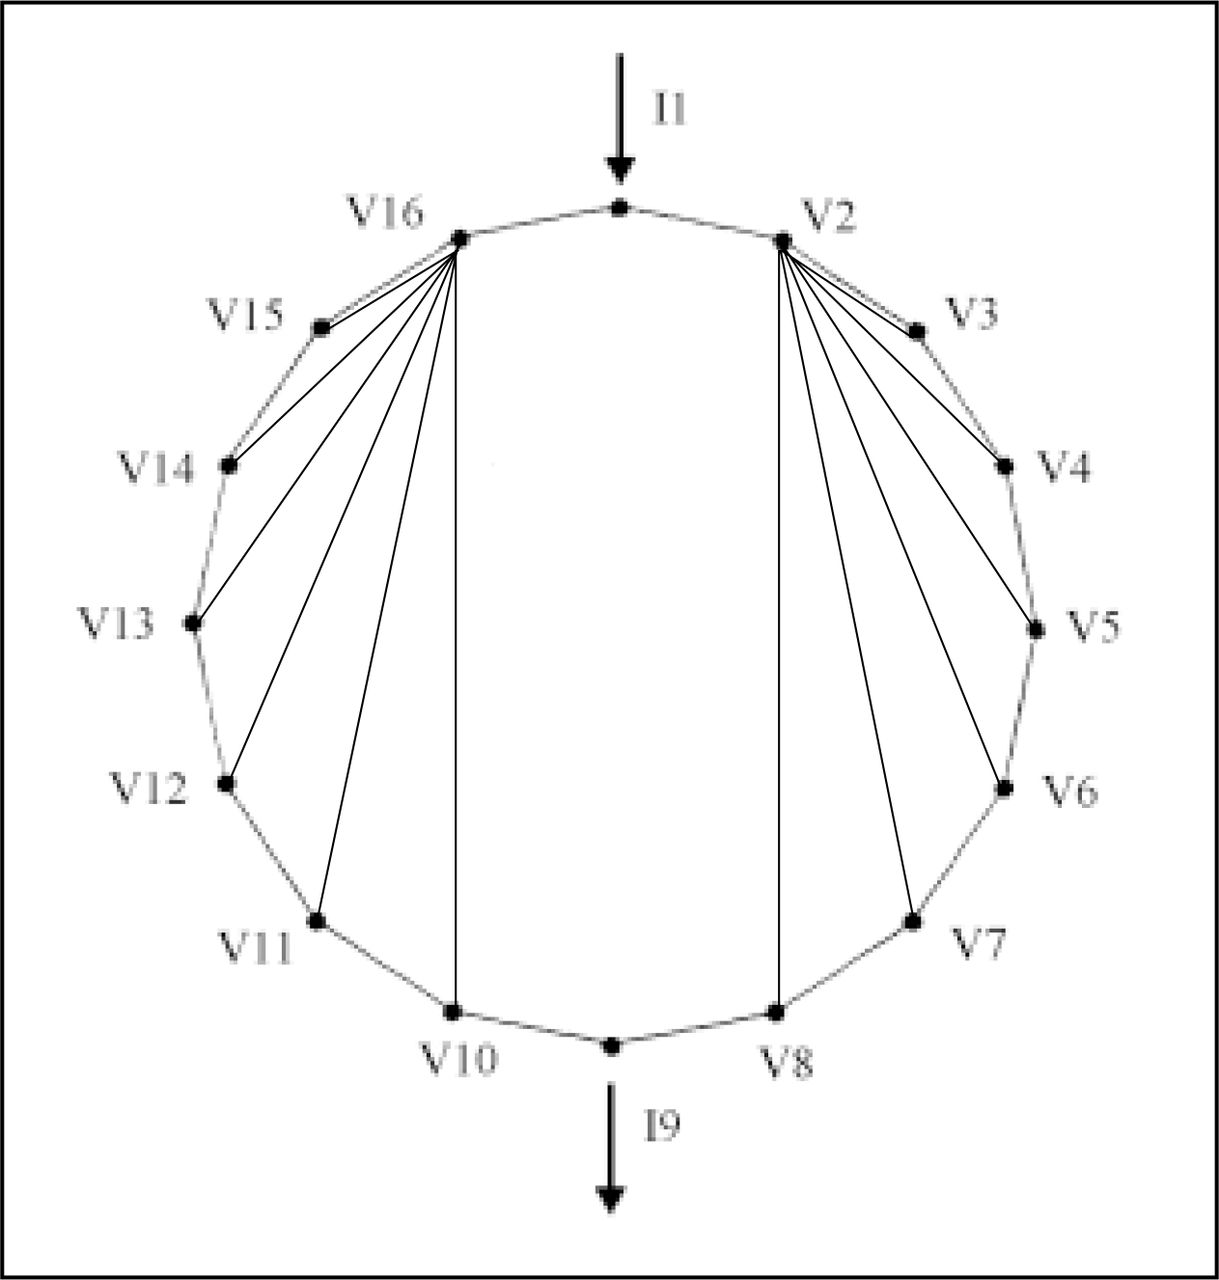
Data acquisition scheme of electric tomography. I: source electrodes; V: receiver electrodes. This picture shows current immission between electrode 1 and 9 and measurement of the potential difference among all other electrodes.
Ultrasonic Tomography
Ultrasonic tomography allows the user to reconstruct the distribution of the velocity of ultrasonic propagation within the investigated section. Because ultrasonic velocity is related to density and dynamic elasticity modulus, decreasing velocity could be, for instance, diagnostic of fungal degradation of the cell wall (Bucur 1995). Furthermore, ultrasonic velocity has been demonstrated to be very sensitive in the early stage of the wood degradation (Wilcox 1988; Bauer et al. 1991).
Acquisition
The ultrasonic equipment used for data acquisition is a PUNDIT (portable ultrasonic nondestructive digital indicating tester), which is a single-channel device (C.N.S. Electronics, London, UK). An electric signal is transformed, by the transmitter probe, in the ultrasonic pulse that travels through the wood and is received by the receiver probe and transformed again into an electric signal, which can be properly amplified and visualized, allowing for travel time measurements. The probe operating frequency is 33 kHz.
The measurements on the trunk were carried out on 16 equidistant points. The transmitter probe was located on point 1, and the ultrasonic pulse was acquired by the receiver probe in all the other points, then the transmitter was moved to point 2. The measurements were repeated for all the other positions of the transmitter probe, allowing for 120 independent travel time measurements for each investigated section (Socco et al. 2002). Acquisitions were carried out without barking the wood and by using a coupling gel, which is less invasive than the electric probes. The measuring point coordinates were detected using a simple, specifically designed mechanical gauge. To visualize and record the received signal, the PUNDIT was connected to an oscilloscope and to a portable computer.
Data Processing
The first step in data processing was the travel time reading and improving the reliability of the travel time detection as much as possible. The traces, recorded from the oscilloscope, were filtered to improve the signal-to-noise ratio. After this data processing, a first-arrival picking procedure was performed and a statistical analysis of the time data was carried out. The difficulty in determining the first arrival of the signal in some of the traces acquired emphasized the problem of making ultrasonic measurements without barking the tree and also serves as a warning about the reliability of some commercial testing devices performing ultrasonic measurements based on autopicking procedures (Berndt et al. 1999).
The travel times and the measuring point coordinates constitute the tomographic processing inputs. The processing was carried out by the software MIGRATOM (USBM), which simulates the ultrasonic pulse propagation as a continuous wavefront, using Fermat’s and Huygens’ principles. Disregarding the mathematical aspect of the inversion algorithm, the calculation procedure that leads to reconstruction of the velocity distribution within the investigated section can be simply described. The velocity calculation is in fact performed by an SIRT (simultaneous iterative reconstruction technique) starting from a discrete initial arbitrary model of the velocity distribution, then computing the forward model travel times, comparing the calculated travel times with the measured times and, consequently, correcting the initial velocity model. These steps are repeated until the calculated and measured travel times match well enough (until the least squares means between calculated and measured times is reached), and thefinal velocity model is then interpreted in terms of mechanical properties distribution.
The frequency range of ultrasonic signals was chosen in order to obtain an adequate spatial resolution. The signal wavelengths are in fact small enough (a few centimeters) to allow the reconstruction of small details inside the trunk. Furthermore, the knowledge of the input signal supplied by the transducer allows a more reliable analysis of the output signals. On the other hand, the high-frequency signals are more strongly attenuated with respect to low-frequency signals, which could create difficulties in the signal travel time reading. Sonic pulse is often used to overcome these attenuation problems. Energizing with a hammer could supply a sonic pulse propagating into the trunk, and this simple means of energization is commonly used. This approach has two main disadvantages. First, the input signal is unknown; second, and more important, the signal wavelengths are not adequate to the resolution needed and therefore are unable to detect anomalies smaller than some tenths of a centimeter.
Georadar Tomography
The radar measurements are based on propagation, reflection, and diffractions of impulses at radio frequency, which are sensitive to changes of electrical conductivity and electrical permittivity of the wood. For testing on materials and for very shallow investigation, very high radar wave frequencies are adopted (1,000–1,500 MHz).
Commonly, ground-penetrating radar (GPR) measurements are carried out in single reflection mode using a small dipole antenna; for wood decay detection, a single antenna at 1,500 MHz is employed.
The impulse propagation on the wood depends on the dielectrical properties of bound water, free water, and cell wall components. Therefore, the total porosity and the total water saturation and salinity affect the radiowave propagation.
Energy, associated with wave propagation, is partially reflected in the presence of discontinuities of the water saturation parameter; the travel time and the amplitude of the reflected events are usually determined.
The main goal of radar experiments on the trunk is to evaluate the possibility of obtaining an energy reflection at the boundary between sound wood and decayed wood.
To evaluate the efficiency of radar investigation, we adopted the following approach:
georadar experiments, in single reflection mode, performed along the perimeter of the two trees
estimation of electromagnetic behavior of wood, starting from laboratory measurements of some physical properties of the four wood disks (moisture, porosity, density, etc.)
data processing of georadar image and interpretation and correlation with physical section of the wood
Data Acquisition and Processing
The main experiments discussed here refer to the data acquisition in single reflection mode using a single antenna applied all around the investigated sections, sticking to the trunk, with the main frequency at 1,500 MHz and a georadar system SIR-2, made by G.S.S.I. Acquisitions, repeated at the same investigated sections (40 and 100 cm from ground level). Also, measurements in transparency modality, using two separate antennas (transmitter and receiver), were performed to estimate the average velocity of radio waves inside the trees.
Horizontal and vertical filtering were applied on raw data for the removal of background noise and to enhance the main events (wave reflection). The filtered data were transformed into polar coordinates to display a radar image for an easier and more realistic comparison with the tree sections.
Electromagnetic Model
The electromagnetic model allows a user to analyze the changes of electromagnetic behavior between sound and decayed wood. The approach followed moves from the classical complex refractive index model (CRIM) (Birchkak et al. 1984). Similar models are proposed in technical literature to estimate the electrical permittivity of wood, considered as a mixture of cell wall, free water, bound water, and air (Torgovnikov 1993).
The electric permittivity of wood samples can be calculated by the following equation:

where em, ep, ea, and e are the dielectric constants, respectively, of fresh wood, dry wood, water, and air; Sw is the wood saturation; Φ is the wood porosity; VT is the total volume; and Vw is the water volume (these parameters can be estimated by laboratory measurements of wood in dry conditions).
We consider only the contribution of real part from permittivity, assuming that the electrical conductivity of the single components is negligible. As a reference value for the dielectric parameter of single components, we can assume

Starting from this approach and considering the porosity and moisture content values (determined by laboratory measurements on the wood samples), we can estimate the distribution of dielectric permittivity values in the investigated sections.
Penetrometer
The tests were carried out by the Resistograph® 1410 at the investigated sections. Two measurements were taken on the section at 90 degrees from each other. These measurements were then repeated in the opposite direction, for a total of four measurements per section where all the other three techniques were applied.
Figure 3 (b, d) shows the drill profiles overlaid to the ultrasonic tomography to facilitate the comparison between the techniques.

(a) Section of tree A at 100 cm; (b) penetrometer graphs overlaid to the ultrasonic tomography; (c) section of tree B at 100 cm; (d) penetrometer graphs overlaid to the ultrasonic tomography.
RESULTS
Both trees, after felling, showed extensive white rot in the central cylinder. Isolation and identification demonstrated that the fungal agent was Ganoderma resinaceum Bourdot. Tree A showed, on both the wood disks, a central decay with a simple geometry (Figure 4a), characterized by a homogeneous wood degradation with a high mass loss (53.6 %) (Table 1). The borders between sound and decayed wood were clearly marked by the compartmentalization barrier. Tree B showed a central decay with a complex geometry (Figure 3c) and a nonhomogeneous degree of wood decomposition (between 22.7% and 33.4% of mass loss) on both the wood disks. The moisture content was always significantly higher in the rotted zones than in the sound ones.
Physical parameters of plane tree wood samples. For each wood disk of each tree, different letters (between sound and decayed samples) show values significantly different for P < 0.01 (ANOVA Tukey HSD test).
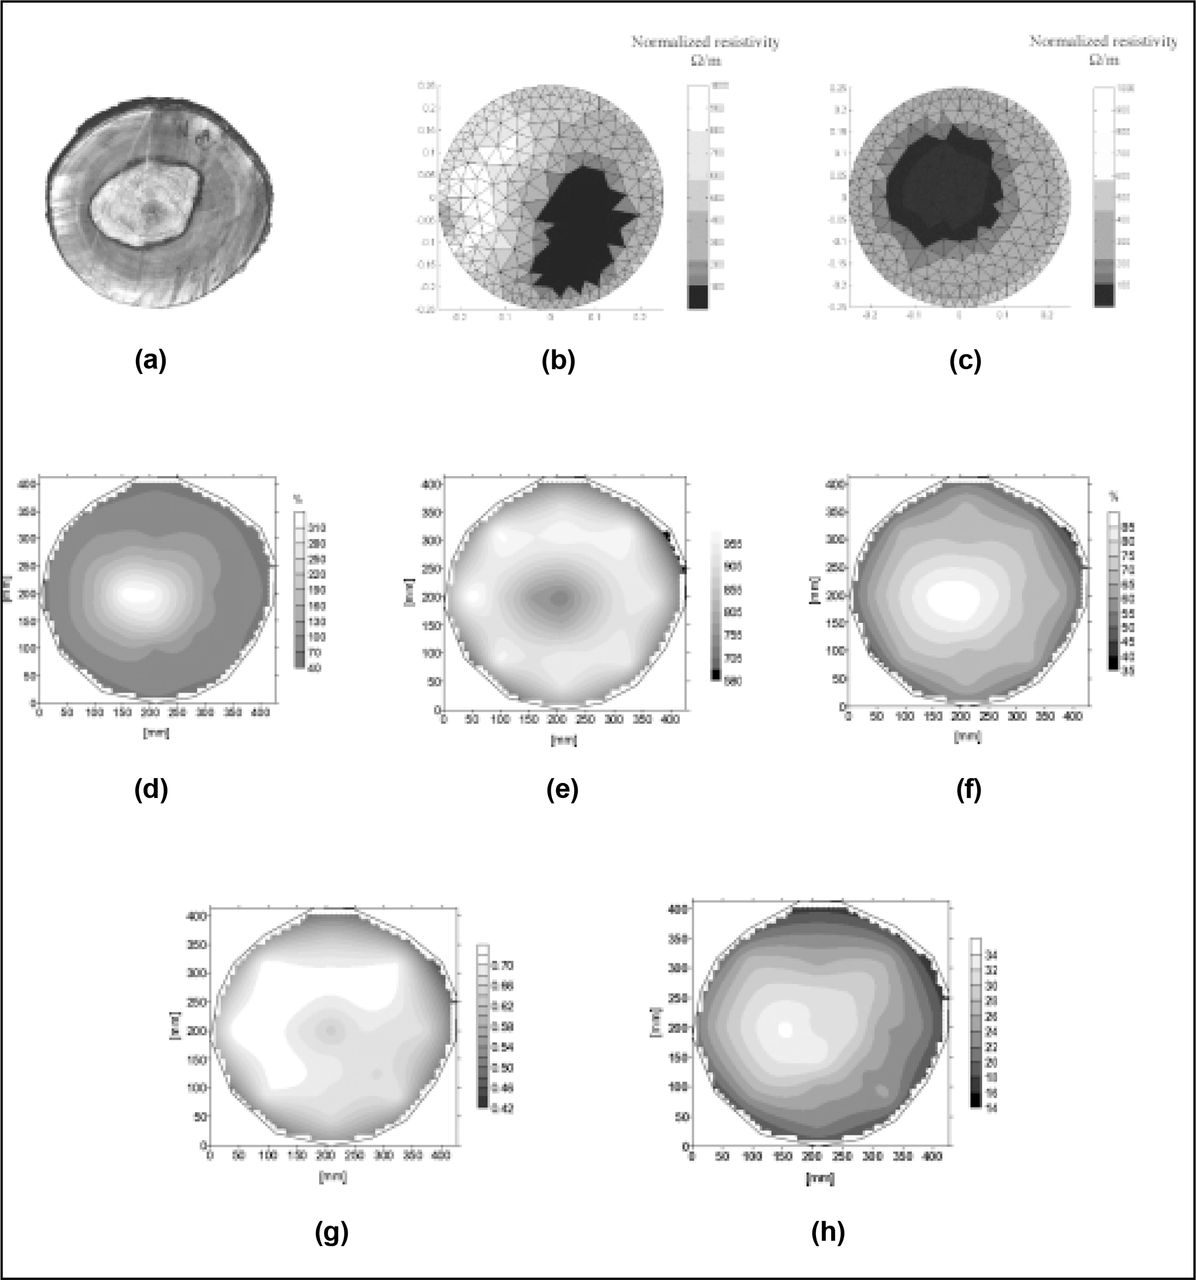
Electrical tomography on tree A at 100 cm of height: (a) section; (b) in situ tomography; (c) in-lab tomography; (d) distribution of moisture content (MC); (e) distribution of density; (f) distribution of porosity; (g) distribution of saturation; (h) distribution of dielectric constant.
The graphs of distribution of the moisture content, density, porosity, and saturation (Figures 4 and 5) were useful for the tomography interpretation, showing a strong correlation with the wood degradation in term of shape and size (Figure 4).

Tree B, at 40 cm of height: (a) section; (b) distribution of moisture content (MC); (c) distribution of density; (d) distribution of porosity; (e) distribution of saturation; (f) distribution of dielectric constant; (g) radar image with distribution of amplitude of reflected signal.
In all four sections, an increase of the moisture content, porosity, and dielectric constant and a decrease of the density and saturation were detected in the decayed zones.
Electric Tomography
Field Surveys
The tomographies revealed low resistivity zones roughly centered in the trunk (Figure 4). A comparison with the successively cut sections shows a fine correspondence to decayed areas. The current intensity used in field measurements varied from 2 to 5 mA.
Laboratory Surveys
Laboratory tomographies on the same section of the tree gave different images from field tomographies. These differences are probably due to many factors, among them the different contact impedances of the electrodes when performing in situ and laboratory tests, sometimes preventing the use of a particular measurement. Therefore, anomalous areas (as in Figure 4b) can be generated because of a lack of information.
The strong relationship between resistivity and moisture is demonstrated in Figure 4, where the correspondence between high-moisture zones and low-resistivity zones is evident. Also, according to literature (Torgovnikov 1993), the inverse relationship between resistivity and dielectric permittivity is evident. In the case of tree A, the geometry and the dimension of the decayed area has been well identified and resolved (Figure 4). The current intensity used in lab measurements was kept constant at 5 mA.
Ultrasonic Tomography
Concerning the detection of rot and decay, the comparison between the results of field and laboratory tomography did not show any significant differences.
Ultrasonic tomography proved to be an effective tool for the detection of internal decay, locating with accuracy the position of the anomalies and estimating their size, shape, and characteristics in terms of mechanical properties (Figure 3). In all the investigated sections, the zones showing an estimated velocity between 600 and 1,200 m/s correspond to the decayed areas, while sound zones showed higher velocities, between 1,200 and more than 2,000 m/s, in agreement with values reported in the literature for sound wood (Sandoz et al. 2000).
The proposed technique is also sensitive to early stages of decay (Bauer et al. 1991). In tree B, for instance, a decay characterized by a mass loss of only 15% was clearly detected.
In all the tomographic images obtained, a low-velocity zone extending in the peripheral zone along the perimeter was evident. The cause of this effect is discussed in the conclusion.
Georadar
Because the permittivity contrast is of primary importance in generating a reflected signal in georadar application, the results depicted in Figure 5 must be analyzed in detail.
With reference to laboratory analysis performed on wood disks, the computed dielectric distribution inside the section is in the range between 10 and 30; the general trend is an increase of dielectric values from the external section to the core of the tree. Particularly, the high values of dielectric are well correlated with the inner decayed core of the two trees. Therefore, we expected a high contrast of electromagnetic impedance between the inner section and the outer section. This justified, from a theoretical point of view, the possibility of detecting the interface between the sound and decayed section of the tree, using radar acquisition in reflection modality.
The radar sections acquired in single reflection mode are represented in polar mode, considering only the time window up to the half time of the travel time inside each tree.
The wavelength in the section was estimated according to the average wave velocity in the section; at the main frequency of 1,500 MHz, we estimated a wavelength of about 6 to 8 cm, equivalent to a radial resolution in the radar image of 2 cm.
With reference to Figure 5, two relevant reflected events can be pointed out: A first event, close to the external boundary of the tree, is related to the interface between the external low-saturated zone and the intermediate part of the section; a strong anomaly in the southeast part of the radar image is correlated to lack in the contrast of electromagnetic impedance of the medium between the external and the internal zones. This section is characterized by a gradual change in the electromagnetic properties from the external decayed area and the internal core of the tree. The second main reflected event is related to the interface between the intermediate (high-saturated zone) and the internal core with low saturation values. This event well depicts the decayed core of tree B.
Penetrometer
Before analyzing the results of this device, we must emphasize that, from the conceptual point of view, it would not be correct to compare the tomographic techniques with the penetrometer because the data they give are different. The tomographic image is the result of dozens of acquisitions on the same section (96 traces for the electric technique and 120 traces for the ultrasonic one); the penetrometer investigation is restricted to the portion of the drill application to the trunk.
The penetrometer test was carried out in this work because, until now, it was the standard method used in the VTA procedure. In any case, the drill profiles detected a low-resistance area inside the two trunks. Particularly in tree A was a good correspondence between the drill profile and the shape of the wood decay (Figure 3b). In the case of tree B, the decayed area, characterized by a low mass loss, was less accurately detected (Figure 3d).
DISCUSSION
All the investigation techniques proposed have been able to ascertain the presence of internal decay through the detection of physical property variations. Particularly, all these variations were evident in correspondence with the drop of wood density (as in tree A) and the moisture increase (as in tree B).
The best results were from the wood disks showing a high mass loss, a homogeneous degradation, a clear compartmentalization barrier, and decay with a simple geometry.
In the case of the wood disk of tree A (section at 100 cm), the wood decay was precisely located by ultrasonic tomography (Figure 3b), by in-lab electric tomography (Figure 4b), and by the penetrometer (Figure 3b).
In the case of tree B (Figure 3c), where the wood disk showed a low wood degradation, a decay with a complex geometry, and a nonhomogeneous status of degradation, the ultrasonic tomography gave the best results, precisely detecting the decayed area (Figure 3d); the other techniques were less precise.
For electric tomography, together with some very good results shown in Figure 4, we still achieved some less reliable ones. The less reliable results were primarily the result of two factors: the use of instruments designed for measuring materials with lower impedance (hardware factor), and a software factor—that is, the first release of the inversion software that considers the trunk as a perfectly round body, which is not always true.
For ultrasonic tomography, a low-velocity peripheral zone is always present on tomographic images. This low-velocity ring is probably the result of wood anisotropy. In the investigated plan, tangential velocity of ultrasonic pulse (VTT) is lower than velocity in radial direction (VRR) (Bucur 1995). In the radial direction, elastic waves propagate along a high-velocity travel path, represented by the medullary rays. Within the tomographic image reconstruction, the velocity values of the peripheral zone of the section are more influenced by signal propagating in the tangential direction and, therefore, by tangential velocity, while for the velocity estimate for the inner part of the section, radial velocity plays a more important role. Previous studies (Socco et al. 2002) have proved how this can generate a “ghost” effect on the tomographic image if the interpretation algorithm is based on an isotropic modeling.
The ultrasonic tomography is a noninvasive technique, even if sometimes the thick bark may represent a problem for wave propagation because of the signal attenuation and the coupling of the transducer to the bark.
Electric tomography requires the use of electrodes inserted into the wood for not more than 3 or 4 cm, and the penetrometer uses drills and penetrates up to 150 cm. In this case, if the compartmentalization zone is formed, we assume that it is pierced and that this hole will be an entry for fungi (Wessolly 1995).
We are now studying and developing capacitance tomography, measuring the dielectric properties of wood by means of electrode plates to be leaned against the trunk without barking it. This approach gives, as a result, a permittivity distribution showing a good correlation with the wood degradation.
For the described investigation techniques, it is not always possible, at present, to supply a quantitative correlation between the variation of the physical parameter estimated and the effective degree of decay. For instance, considering the results of ultrasonic tomography, the velocity values estimated for the decayed areas are, in the case of tree A (42% of mass loss) between 600 and 1,000 m/s (Figure 3b), while in the case of tree B (21% of mass loss), the velocity is between 700 and 1,100 m/s. The estimated velocity value is then diagnostic of the fact that the area is characterized by decay but is not able to discriminate among different degrees of the decay itself. This fact is mainly a result of underestimation of the velocity decrease in the decayed area caused by the fact that ray paths tend to avoid low-velocity regions and, therefore, the corresponding travel times do not contain information on the material within these slow areas. In addition, tomographic processing in general tends to reduce the parameter contrasts, supplying a smoothed image.
The tomography investigations are able to detect small “anomalies” into the trunk. With the ultrasonic technique, the smallest detectable size depends on the frequency: The higher the frequency, the smaller the wave length. In our study, the frequency of 54 kHz allows the detection of anomalies of about 5 cm.
This last aspect has a practical spinoff allowing arborists to detect wood decay at an early stage, which allows them to plan the future management of the tree.
Moreover, the tomographic approach gives not only information about the decay extension but also provides information about the physical properties of the sound wood (i.e., density and modulus of elasticity).
The lack of user-friendly devices for rapid data acquisition and easy interpretation is, at the moment, the main handicap to be solved. On the other hand, the high potential of the techniques described and the sensitivity and the detail they showed in detecting wood decay at their early stage press us to carry on our research in this direction.
- © 2003, International Society of Arboriculture. All rights reserved.
In this issue


Jump to section
Related Articles
Cited By...
- No citing articles found.