
Abstract
Between 1995 and 1999, a monitoring program was implemented in the City of Sacramento, California, U.S., where treatment decisions for elm leaf beetle (Xantho-galeruca luteola) were made based on presence or absence of egg clusters at each generation egg peak. The damage prediction model proposed by Dahlsten et al. (1994) was effective at predicting damage in Sacramento in both the first and second generations. Addition of the Sacramento data collected between 1995 and 1999 to the model does not change the treatment threshold for the first generation but does raise the treatment threshold in the second generation to approximately equal that for the first. A similar model for the third generation suggests a much higher treatment threshold; however, more data are needed for this generation. Subsampling 20% of the susceptible trees and resampling additional trees in areas where egg clusters were found is effective in locating areas of beetle activity. Between 1995 and 1999, an average of 11.3% of trees managed using the monitoring system required treatment. This finding represents a dramatic reduction in pesticide use and cost when compared to the previous strategy of treating all susceptible elms on a calendar basis.
The elm leaf beetle (ELB), Xanthogaleruca luteola (Mulller), was accidentally introduced into the United States in the 1830s at Baltimore, Maryland, U.S. (Glover 1871; Riley 1883). ELB is now present in North America almost everywhere elms are planted (Davidson 1979). It is the second most important urban tree pest in the western United States and third most important nationally according to a 1986 survey of more than 1,500 urban tree managers (Wu et al. 1991).
The beetles overwinter as adults in sheltered places such as woodpiles, garages, and attics. As the foliage begins to develop in the spring, the adults emerge from their hiding places and feed on the foliage for 1 to 2 weeks before starting to lay eggs. Adult feeding is characterized by small, circular, BB-size holes in the foliage. Eggs are yellow and oblong and are laid in clusters averaging 15 to 20 each. The larvae, which are the most damaging stage, develop through three instars. Larval feeding can be distinguished from adult feeding because larvae skeletonize the foliage, leaving a thin membrane instead of holes all the way through the leaf. Heavy infestations can cause leaves to drop and can completely defoliate a tree. When ready to pupate, the larvae crawl into holes in the trunk of the tree or limb crotches, beneath loose bark, or commonly to the base of the tree, where they gather in large numbers. Depending on climate, there can be one to three generations per year in the northern part of California and even more in the southern part of the state (Dahlsten et a1. 1998). The preferred host trees are English elms (Ulmus procera Salisbury) and to a lesser extent Siberian elm (U. pumila L.) followed by American elm (U. americana L.) and Chinese elm (U. parvifolia Marsham) (Luck and Scriven 1979).
Between 1984 and 1993, Dahlsten et al. developed a sampling technique to predict defoliation by elm leaf beetle within a given generation based on presence or absence of egg clusters (Dreistadt and Dahlsten 1989; Dahlsten et al. 1993; Dahlsten et al. 1994; Dahlsten et al. 1998). During that period, over 200 trees in more than 25 locations in northern and central California, U.S., were sampled. A degree-day model was developed to determine the best time to sample and treat for elm leaf beetle based on degree days accumulated above 1°C beginning March 1 (Dreistadt et al. 1991; Dahlsten et al. 1994). A 30 cm elm branch terminal is the sampling unit on which the monitoring system is based. A system was proposed for number of samples per tree and percentage of trees to be sampled based on the size of the stand of trees to be evaluated. The proportion of samples found to have viable egg clusters present at the peak of egg density was shown to be effective at predicting damage for that generation, which allows tree managers to determine the need for treatment before damage occurs and avoid unnecessary applications of pesticides.
Although the monitoring model suggested by Dahlsten et al. (1994) seemed particularly useful to urban tree managers, it had not yet been adopted by a municipality as a primary management technique. Also, the model was developed on small stands of trees and had not yet been tested in a large-scale urban setting under operational conditions.
The City of Sacramento, California, has long been known as the “City of Trees” and has upward of 5,000 elms (McPherson and Luttinger 1998). Many of these elms are American and Chinese elms which are not particularly susceptible to the elm leaf beetle (Luck and Scriven 1979; Young and Hall 1986; Dahlsten et al. 1998); however, there are still more than 2,000 susceptible elms in the city. Since 1940, the city has used chemical treatments in an effort to control elm leaf beetle (McPherson and Luttinger 1998). Compounds used ranged from lead arsenate in the 1940s and DDT in the 1950s (McPherson and Luttinger 1998) to Bidrin (dicrotophos) and Metasystox-R (oxydemeton-methyl) in the 1980s and early 1990s (Robert Hughes, City of Sacramento Department of Neighborhood Services, pers. comm. 1999). In the mid-1990s, when we first began our work in Sacramento, the city was treating all city-owned, susceptible elms with a systemic injection of Metasystox-R based on a calendar start date. In years of heavy infestation, many trees were treated twice within a season.
A large city with many susceptible elms such as Sacramento was an ideal location to test the model proposed by Dahlsten et al. (1994). If, by monitoring subsample trees at ELB egg peak, areas of beetle activity could be located and damage from that generation could be predicted, then control efforts could be directed more efficiently to specific trees that required treatment. Such targeting of control efforts would have the potential to reduce the number of trees treated unnecessarily as well as drastically reduce the pesticide load to the environment. The reduction in the number of treated trees should also provide a cost savings to the city.
In 1995, we began a cooperative effort with the City of Sacramento Department of Neighborhood Services and the Sacramento Tree Foundation’s Save the Elms Program (STEP) to implement an integrated pest management program for the elm leaf beetle based on the monitoring program proposed by Dahlsten et al. (1994). Here we outline observations made in Sacramento between 1995 and 1999 on the proportion of samples with egg clusters present at the predicted egg peak versus damage from that generation on untreated trees and compare these data to the previous model. The data from Sacramento are combined with previous data to refine the model, and new data are proposed for the third ELB generation. The expansion of the monitoring program from four small plots in 1995 through 1999 when the entire city was managed using the program is outlined as well as the numbers of trees requiring treatment. Changes to the model, which allowed implementation on a large scale, are also detailed.
METHODS
In each year from 1995 through 1999, progressively larger areas of the city were set aside by Neighborhood Services to be managed using the monitoring program. In 1995, 85 trees in four plots were set aside, and by 1999 all susceptible elms in the city were managed using the program (Figure 1). Susceptible elms were considered English elm, Siberian elm, and hybrid elms that closely resembled them. Each year, trees in the plots were counted and mapped, and sample trees were chosen. In 1995 and 1996, a minimum of ten sample trees per plot were used. In 1997, 25% of the trees were subsampled and in 1998 and 1999, this sampling was reduced to 20%. Subsample trees were chosen in a stratified random pattern to cover the entire area of a plot. In 1997 through 1999, when a sample tree was found to have egg clusters present near the treatment threshold, adjacent trees were then sampled to determine the extent of the infestation. The number of trees in plots managed using the monitoring program and the number of subsampled trees for each year are shown in Table 1.

(A) Map of 11 sites managed using monitoring program, Sacramento, 1996. (B) Ten larger sites monitored in 1997. (C) Half of the city (shaded area) was monitored in 1998. (D) All areas of the city (shaded area) were monitored in 1999. Four small sites monitored in 1995 are omitted.
Number of elms managed using the monitoring program, the number of subsample trees, and the number of trees in monitoring areas that required treatment, Sacramento, 1995–1999.
Trees were sampled at each generation egg peak as determined by a degree-day model (Dahlsten et al. 1993; Dahlsten et al. 1994). Degree days were measured using biophenometers (Omnidata Corp, Logan, UT) placed in two locations in the city: one at the City Corporation yard at Miller Park and the other on the opposite side of town at 3473 V Street. In 1999, only the Miller Park location was used.
On each sample tree, 16 branch terminals 30 cm long were sampled from the lower canopy using a pole pruner; two from the inner canopy and two from the outer canopy in the four cardinal directions. Damage for each branch tip was rated on a scale of 0 to 10 (10 being 100% defoliation) by comparing to a visual standard (Dahlsten et al. 1993), and presence or absence of ELB egg clusters was noted. All trees in the monitoring areas were evaluated for overall tree damage at the end of the season using the same scale. Estimates of whole tree damage were made independently by two people evaluating the entire tree canopy, and damage was calculated using the mean of the two ratings. Net damage for each beetle generation was calculated by subtracting the damage at the beginning of the beetle generation from the damage at the end of that generation.
In 1995 and 1996, trees were sampled by University of California personnel and temporary workers hired by STEP and Neighborhood Services expressly to work on this project. In 1997, regular, full-time maintenance workers from Neighborhood Services were trained in monitoring techniques and assisted U.C. personnel in sampling. In 1998, Neighborhood Services personnel completed most of the monitoring under the supervision of U.C. personnel, and in 1999 all monitoring was completed by Neighborhood Services with the exception of end-of-season damage surveys.
In 1995 and 1996, 40% defoliation was used as the acceptable damage threshold.
At the suggestion of Sacramento Neighborhood Services, the acceptable damage threshold was lowered to 20% in 1997 and all subsequent years. The treatment threshold for a 40% damage threshold was a proportion of samples with egg clusters present >0.45 for the first generation and >0.3 for the second beetle generation (Dahlsten et al. 1994). Using the same data, the treatment threshold for a 20% damage threshold was a proportion of samples with egg clusters present >0.3 for the first generation and >0.2 for the second beetle generation with a probability of error of 10%. Because no data were available for the third-generation treatment threshold, the second-generation threshold of >0.2 was used.
Each year, test sites were established to test various ELB treatments in which trees with proportions of samples with egg clusters present above the treatment threshold were split into two groups. One group received treatment and the other remained untreated as a control. Here the control trees are used to evaluate the damage prediction model outlined by Dahlsten et al. (Dreistadt and Dahlsten 1989; Dahlsten et al. 1993; Dahlsten et al. 1994). In addition, trees with egg clusters present below the treatment threshold as well as trees that showed some defoliation were used to evaluate the model. Trees that had no egg clusters present and showed no defoliation were excluded from the analysis, as were trees in the third generation of 1996 and 1998 that had high rates of parasitism by Oomyzus gallerucae (Fonscolmbe). These egg parasitoids were released by us early in each of those years, but they failed to overwinter (Lawson 2000).
Proportion of samples with egg clusters present was plotted against damage from that generation for first, second, and third beetle generations. This procedure was followed for individual trees as well as blocks of trees. Blocks of trees ranged from 5 to 14 trees per block. Twenty percent defoliation was used as the treatment threshold because it more accurately reflects what is considered acceptable in Sacramento.
RESULTS
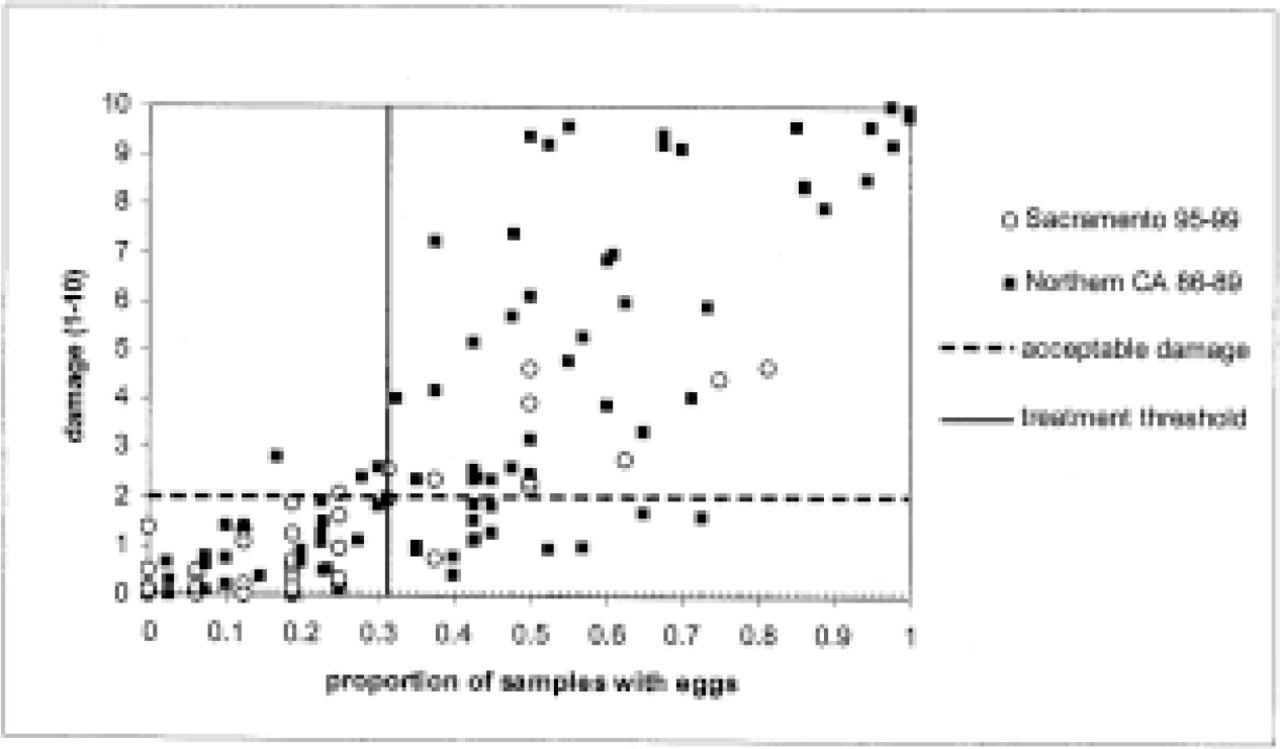
Proportion of samples with egg clusters versus damage on individual trees in generations 1 and 2 fits well with the model proposed by Dahlsten et al. (1994). When data collected over the five year period in Sacramento are added to the model for generation 1, the treatment threshold does not change (Figure 2). Only one tree with a proportion of samples with eggs <0.3 had a damage greater than the acceptable threshold of 2 (a tree in the city cemetery in 1995 with a proportion of samples with eggs of 0.25 and a net damage of 2.06).

Proportion of samples with egg clusters present versus damage for individual trees in the first elm leaf beetle generation. Data collected in Sacramento between 1995 and 1999 are added to the model published by Dahlsten et al. (1994), and treatment threshold is calculated using cumulative probability of damage greater than 20% (probability of error = 10%).
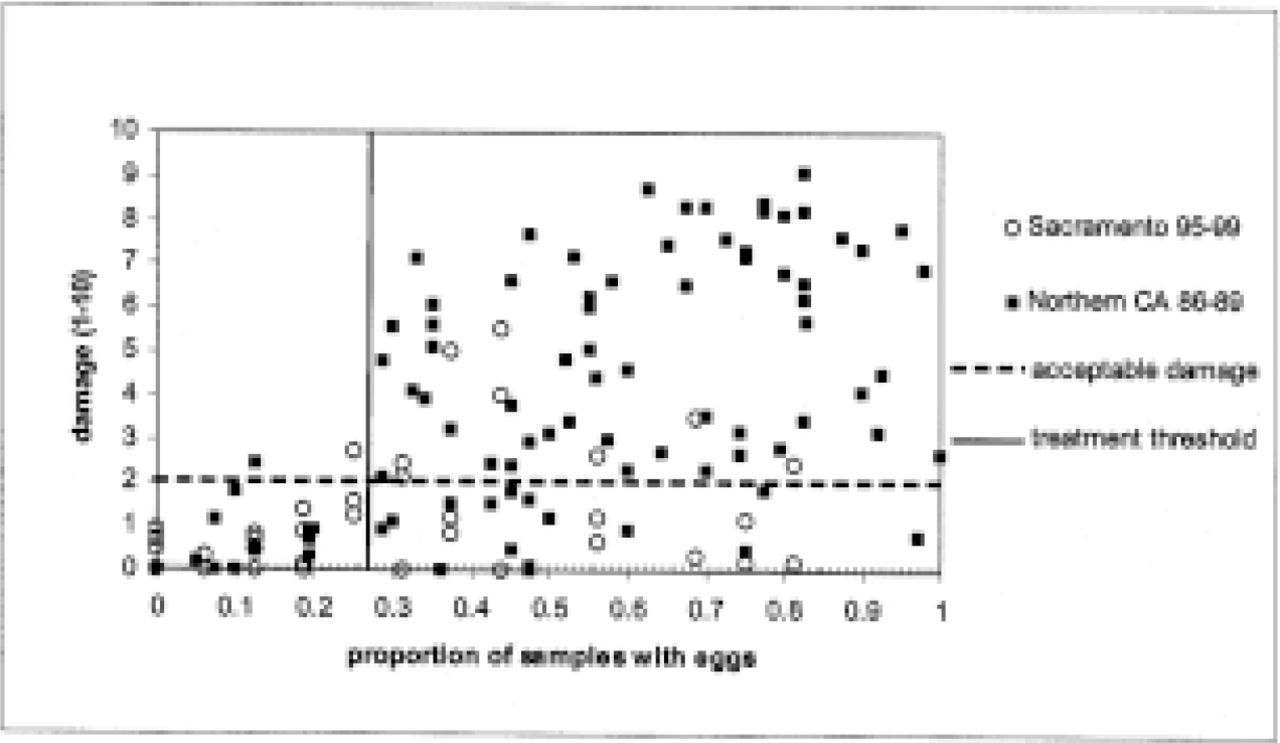
For the second generation, when the Sacramento data are added to the model, the treatment threshold actually increases slightly from 0.2 to 0.27 (Figure 3). No trees with a proportion of samples with eggs <0.2 were damaged over the acceptable threshold. Only one tree at Marshall School in 1998 had a proportion of samples with eggs <0.27 and had a damage greater than 2 (proportion of 0.25 and net damage of 2.69).

Proportion of samples with egg clusters present versus damage for individual trees in the second elm leaf beetle generation. Data collected in Sacramento between 1995 and 1999 are added to the model published by Dahlsten et al. (1994), and treatment threshold is calculated using cumulative probability of damage >2 (probability of error = 10%).
A damage prediction model for the third generation was not outlined by Dahlsten et al. (1994) due to a lack of data on third generations. Comparison of proportion of sampleswith egg clusters present versus damage suggests most damage in the third generation is relatively low (Figure 4). Cumulative probability of trees with damage <2 suggests a treatment threshold of 0.7 with a probability of error of 10%. Because very little data are available at higher egg densities, cumulative probability may not be the best measurement. There seems to be a noticeable increase in damage above the acceptable threshold with a proportion of egg clusters present >0.4.

Proportion of samples with egg clusters present versus damage for individual trees in the third elm leaf beetle generation in Sacramento between 1995 and 1999. The treatment threshold is calculated by the cumulative probability of damage greater than 20% (probability of error = 10%).
Because tree managers would likely find it more feasible to base treatment decisions on a stand of trees rather than individual trees, the average proportion of samples with clusters present for blocks of trees was fit to the model. Damage at all sites in generations 1 and 2 were within the predicted range. In generation 3, blocks of trees indicate a lower treatment threshold (0.3) than was calculated using individual trees.
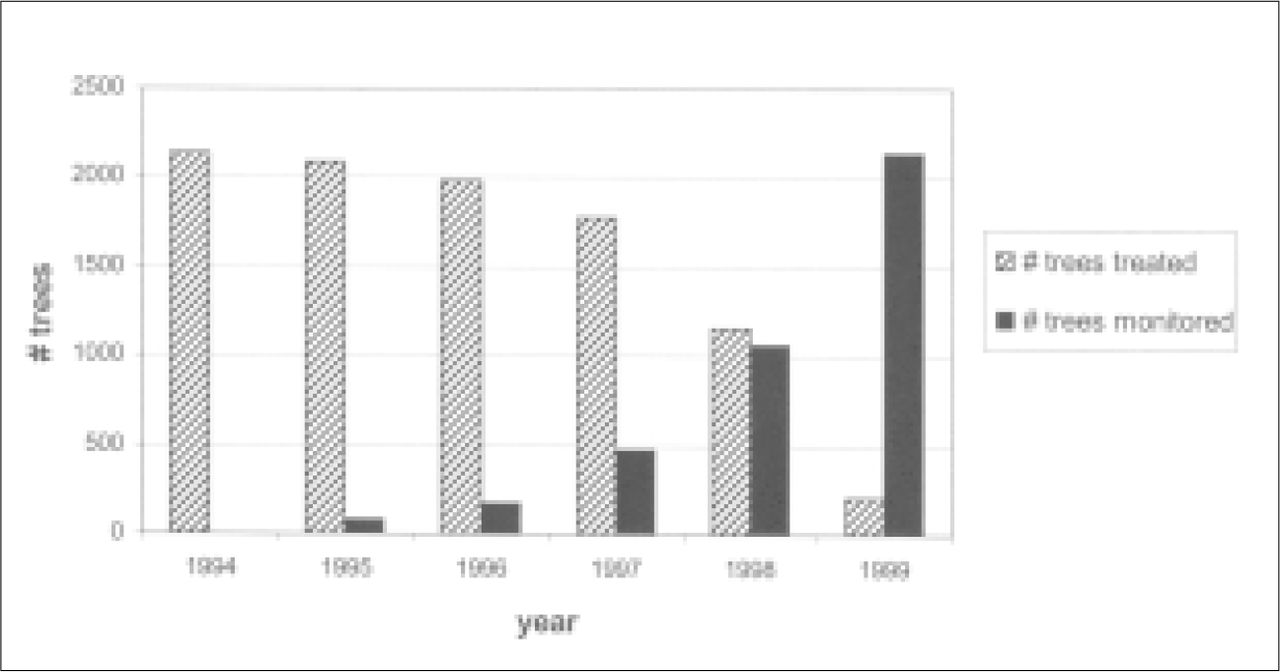
End-of-season damage surveys on all trees in the monitoring areas indicated no damage on trees above the acceptable threshold in areas that were not detected during sampling, The number of trees in the monitoring areas that required treatment is listed in Table 1 for each year. Although the percentage of trees requiring treatment each year varied, over the 5 years only 13% of the trees required treatment. The number of elms treated throughout the city decreased from 1995 to 1999 as progressively larger proportions of the trees were managed using the monitoring program and fewer trees were managed using a calendar-based treatment schedule (Figure 5).

Number of elms treated compared to number of elms monitored from before monitoring began in 1994 through 1999, when all susceptible elms were managed using the monitoring program, Sacramento, California.
DISCUSSION
The monitoring method proposed by Dahlsten et al. (1994) successfully predicted damage
based on presence of egg clusters in the first and second generations. Addition of the Sacramento data to the model does not change the treatment threshold for the first elm leaf beetle generation but does slightly increase the threshold for the second generation. This increase in the threshold was due mainly to an increased number of data points in the model with damage <2 and proportion of samples with eggs <0.2. These new data were within the same range as reported in the earlier model and allowed for a decrease in error. Dahlsten et al. (1993; 1994) suggested that their model may require additional data to be refined, particularly in the second generation. Because the revised treatment threshold for the second generation is very close to that for the first generation (proportion of samples with clusters of 0.27 versus 0.3), tree managers may find it simpler to use the same threshold for both generations.
The average proportion of samples with clusters present for blocks of trees also fits well in the previous model for the first and second generations. Tree managers would likely find it more feasible to base treatment decisions on a stand of trees rather than individual trees. A manager may average the proportion of samples with eggs present across a stand of trees and base a treatment decision on this average rather than assessing individual trees.
The proportion of samples with egg clusters versus damage in the third generation for individual trees suggests a treatment threshold of 0. 7. Very few trees in the third generation over the 5 years had a net damage above the acceptable threshold of 20%. It is possible that defoliation in the first and second generations reduced the quality of the leaves for the third-generation larvae, reducing their potential for damage. Considerably less data are available for the third generation than earlier generations. In addition, the period of egg-laying activity is extended in the third generation, and distinct periods of egg-laying activity become less clear. The lack of data and increased variability in the third generation make prediction of damage difficult, although it appears that defoliation from this generation is generally light in Sacramento.
The average proportion of samples with clusters present for blocks of trees in the third generation suggests a lower treatment threshold than the data for individual trees. Managers making decisions based on the average proportion of samples with clusters for blocks of trees may wish to use the same treatment threshold used in the first two generations. However, this suggestion is based on limited data and is likely an overly cautious threshold. More data are required to model damage prediction in the third generation accurately.
End-of-season whole tree damage estimates found only minor damage on trees not detected during sampling at egg peak. The method of subsampling 20% of the susceptible trees and resampling additional trees where egg clusters were found appears effective in locating areas of beetle activity. Locating areas of beetle activity and predicting damage in that area allows tree managers to direct control efforts more efficiently than a calendar-based system of treating all susceptible trees.
From 1995 through 1997, the percentage of trees requiring treatment varied between 10.2% and 30.6%. These higher percentages were mainly due to the early plots being placed in areas that had historically been high in beetle activity, particularly the city cemetery. In 1998, when half of the city was managed using the monitoring program and in 1999 when the entire city was included, 7.9% and 9.8%, respectively, of the trees actually required treatment. By monitoring and spot treating only the areas with egg clusters present above the treatment threshold, the number of trees treated and the pesticide load in the environment is reduced by more than 90% when compared to the previous strategy of treating all susceptible trees. Cities across the United States are coming under increased pressure from the public to reduce the amount of pesticides used in the urban environment. For example, the City of San Francisco passed a measure in 1996 that mandated the phasing out of most pesticides used by the city by the year 2000 (San Francisco Board of Supervisors 1996). This program has demonstrated how a scientifically based, user-friendly monitoring program may help municipalities reduce their use of pesticides while still maintaining adequate control of their insect problems.
Although the cost of monitoring increased substantially, the program allowed a net cost reduction to the city, mainly in reduced cost of pesticides and reduced labor in their application. The Department of Neighborhood Services estimated a net savings of approximately $62,000 per year due to the monitoring program in 1999 (Robert Hughes, City of Sacramento, Department of Neighborhood Services, internal memo, November 7, 1999).
City workers whose jobs previously focused on treatment of trees with systemic insecticides were retrained to perform monitoring duties in addition, so there was no loss of jobs within Neighborhood Services. Additionally, the reduction in time spent by Neighborhood Services treating trees allowed for more time to be spent performing tree maintenance tasks such as tree pruning (Martin Fitch, City of Sacramento Department of Neighborhood Services, pers. comm. 1999).
CONCLUSION
The damage prediction model proposed by Dahlsten et al. (1994) was effective at predicting damage in Sacramento in both the first and second generations. Addition of the Sacramento data collected between 1995 and 1999 to the model does not change the treatment threshold based on presence or absence of egg clusters for the first generation but does raise the treatment threshold in the second generation to approximately equal that for the first. A similar model for the third generation suggests a much higher treatment threshold but is based on very limited data. Generally, damage in the third generation was light. Monitoring to locate areas of beetle activity, coupled with the damage prediction model, allows tree managers to direct control efforts more efficiently than calendar-based treatments. Monitoring has decreased the number of trees treated in Sacramento, resulting in decreased pesticide load in the environment and as well as a considerable cost savings to the city. The Department of Neighborhood Services has adopted this monitoring program as the center of its elm leaf beetle management program.
Acknowledgments
We would like to acknowledge Martin Fitch and Bob Hughes of the Sacramento Department of Neighborhood Services, and Ray Tretheway and Anne Fenkner of the Sacramento Tree Foundation. The work presented here was part of a dissertation submitted in partial fulfillment of the requirement for Ph.D. degree by Andrew B. Lawson at the University of California, Berkeley. This work was made possible in part by a grant from the California Department of Pesticide Regulation.
- © 2003, International Society of Arboriculture. All rights reserved.
In this issue


Jump to section
Related Articles
Cited By...
- No citing articles found.