
Abstract
The objective of this study was to establish a reasonably accurate demand forecasting model for municipal street tree services on Staten Island, New York. Using the raw data gathered from years from 1996 through 2000, a chart and mathematical equation for anticipated monthly demand were derived for the year 2001. The development of the model was accomplished with simple arithmetic computations and computer-assisted regression analysis. Although occasional storm damage skewed some monthly figures, it is apparent that demand for public tree maintenance on Staten Island is decidedly seasonal and predictable.
Nestled just south of Manhattan and to the east of New Jersey is the City of New York’s borough of Staten Island, U.S. With a land mass of approximately 153 km2 (59 mi2) and a human population of 440,000, the demands for service from municipal government can be imposing. According to some estimates, there are 80,000 existing street trees for which the borough forestry office of the Department of Parks & Recreation has maintenance jurisdiction. Whether it is a request for tree pruning, removal, or emergency storm damage assistance, the forestry office receives phone calls from residents year round.
The relative importance of municipal arboriculture service is not universal. Differences remain between communities and their budgeted forestry dollars. Professional forestry managers could be envious of a program such as Milwaukee’s in which their staffing and equipment needs are met to allow for a comprehensive routine maintenance program (Zillmer et al. 2000), but that program is a luxury not every community has. Staten Island forestry operates on a comparatively reduced budget. The borough tree work is accomplished with a total staffing level of 13 city employees, including office personnel, supervisors, and field personnel using two bucket trucks, two chippers, a hydraulic loader, and a stump grinder. When additional budgeted dollars become available, expense contracts are granted to allow private tree firms a chance to help the borough catch up with needs.
The borough administration considers it the job of the borough’s forestry office to satisfy the public’s desire for routine tree maintenance while at the same time helping to eliminate potential tree-related hazards. With the ability to forecast an anticipated workload, the forestry office believes it can better match service with demand. The objective of this paper is to document an anticipated demand chart that helps to quantify the amount of work that climbers and pruners would be asked to perform during the year 2001. The raw data presented were obtained from the office of the New York City Department of Parks & Recreation, Division of Forestry, Staten Island, New York.
METHODS
Record keeping is essential in any municipal operation. The importance of accurate information is evident during questions of accountability, recurring budget negotiations, and resource allocations. It is the operational decision of borough administration to inspect city park and street trees at the request of residents. The forestry office answers the request by recording the information and having the tree inspected. The inspector makes a site visit to determine whether the city forestry crews need to address a problem. If warranted, a new work order is generated and a crew is sent to the location for work needed.
Monthly management reports from the borough forestry office were used to collect the informational data of all resident requests that generated new work orders. Requests of a general nature and repeat inspections were not analyzed in this study because of the low percentage of work actually generated from this information. All work orders are recorded in categorical fashion, with designations ranging from tree removals to limbs down. For the purposes of this paper, all new work orders were combined into the single category to allow for a more executive awareness of the operation.
Data on new work orders generated were collected for the years 1996 through 2000. Tree removal, pruning, and root slicing for sidewalk repairs are routine requests that are often addressed by the inspectors and crew. Emergency situations such as trees down, limbs down, and hanging limbs during periodic storm conditions are also accounted for on the reports. Each of the differing work requests were tallied on a monthly basis, combined into a single category, and then averaged over the 5 years. The resulting information is documented in Table 1.
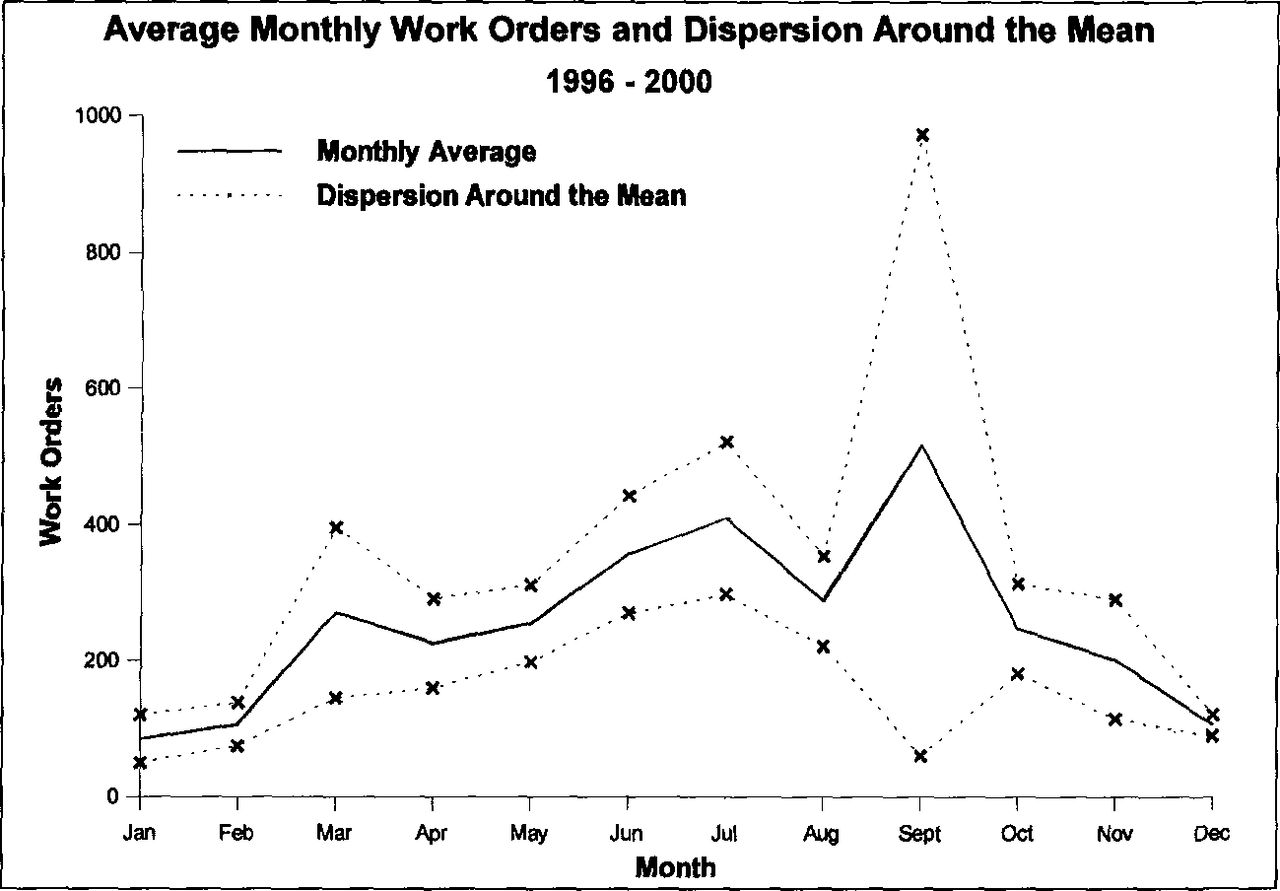
Number of work orders generated for a 5-year period (1996-2000).
Although averaging the data over a period of years may prove to be an acceptable method for reasonably predicting future demand, this paper takes the information a step further and identifies the monthly standard deviation statistic as well as the overall yearly trend. The standard deviation statistic is a measure of dispersion around the mean, and the regression analysis is used as a way to determine the data trend. Computer processing was accomplished with the personal computer statistical software package SPSS for Windows Student Version Release 6.0.1 (Norusis 1993).
RESULTS AND DISCUSSION
It can be difficult to accurately predict demand. Figure 1 shows the average monthly work orders and dispersion around the mean. Each month shows differing amounts of variability. It is not surprising to find that the greatest amount of scatter exists during the months of seasonal change and resulting storm activity. It is during this time that resources are put to the greatest test. One such notable period was during the month of September 1998, when a Labor Day storm wrecked havoc on the urban forest and stretched borough resources to extreme levels. While these storms are unpredictable, they do not occur often. Averaging monthly data over several years can help smooth out any unexpected spike in work requests.

Average demand for service.
The software package was successful in calculating the best fit curve on our monthly data. A third-degree degree polynomial was shown to be the most satisfactory equation available to represent this curve:
y = 53.7051 + 25.6376x + 9.6384x2 - 0.9605x3 where y = the predicted value, and x = the month of the year (January = 1, February = 2, … December =12)
This information is graphically illustrated in Figure 2.

Forecasted demand for services. y = 53.7051 + 25.6376x + 9.6384x2 + 0.9605x3.
According to Berenson and Levine (1989), a statistical model is only an approximation of the exact relationship between two variables. The regression line serves as an approximate predictor of a y value for a given value of x. Norusis (1993) points out that the commonly used measure to assess goodness of fit of a linear model is R2. Furthermore, the adjusted R2 statistic attempts to correct R2 in ways to more closely reflect the goodness of fit of the model in the population. Our computer output calculated an adjusted R2 value of 0.629. By using the regression model, the variability in predicting work orders has been reduced by 63%. The remaining 37% of the variability can be explained only by factors other than the month of the year. Other factors that may have an influence in the number of work order requests received include changing weather conditions or even the changing desires and needs of an increasingly diverse human population. Because this fitted line of regression is a line that fits the data with a minimum amount of variation, we consider the regression model (Figure 2) an acceptable representation of the anticipated public demand for tree service on Staten Island during the forecast year 2001.
Examining the graphed data in Figures 1 and 2 shows that the demand for municipal tree work service is decidedly seasonal. The late spring and summer months prove to be the time of year with the greatest amount of service requests and newly generated work orders, while demand for service tapers off in the autumn to a wintertime lull before picking up again. Understanding the seasonal nature of the business is but one aspect of managerial preparedness. Identifying specific quantities for future demand can be a realistic first step in meaningful operations research.
SIGNIFICANCE TO THE ARBORICULTURE INDUSTRY
When faced with restrictive budgetary constraints, it is incumbent upon all administrators to seek out and provide better management practices. Whether or not municipal arboriculture programs should provide scheduled routine tree maintenance or an operation dedicated to service on demand is subject to the needs and wishes of the taxpaying public and elected officials. Demand forecasting can be used as a tool to better understand, evaluate, and serve the needs of the community.
- © 2001, International Society of Arboriculture. All rights reserved.
In this issue


Jump to section
Related Articles
Cited By...
- No citing articles found.