
Article Figures & Data
Figures
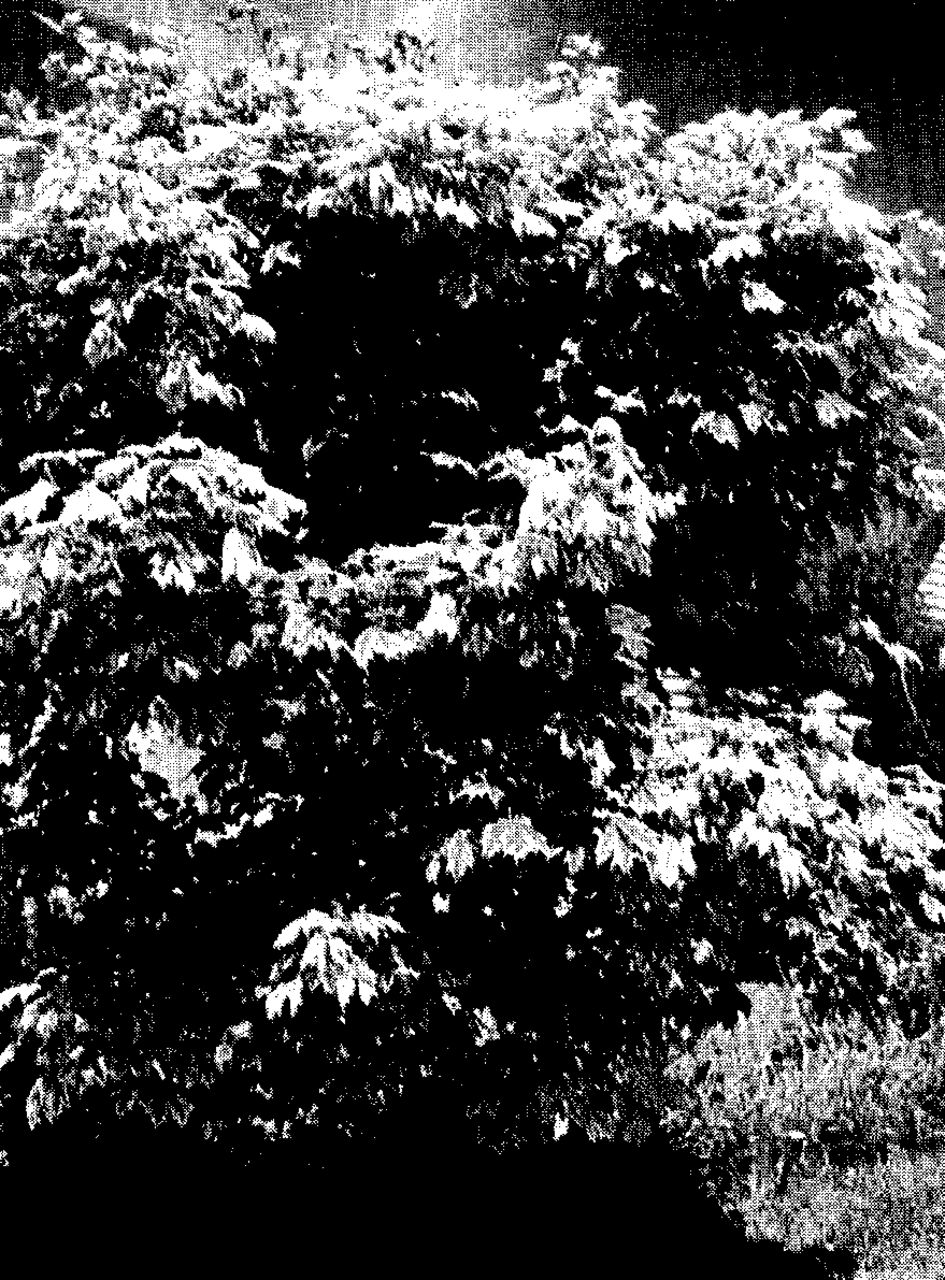
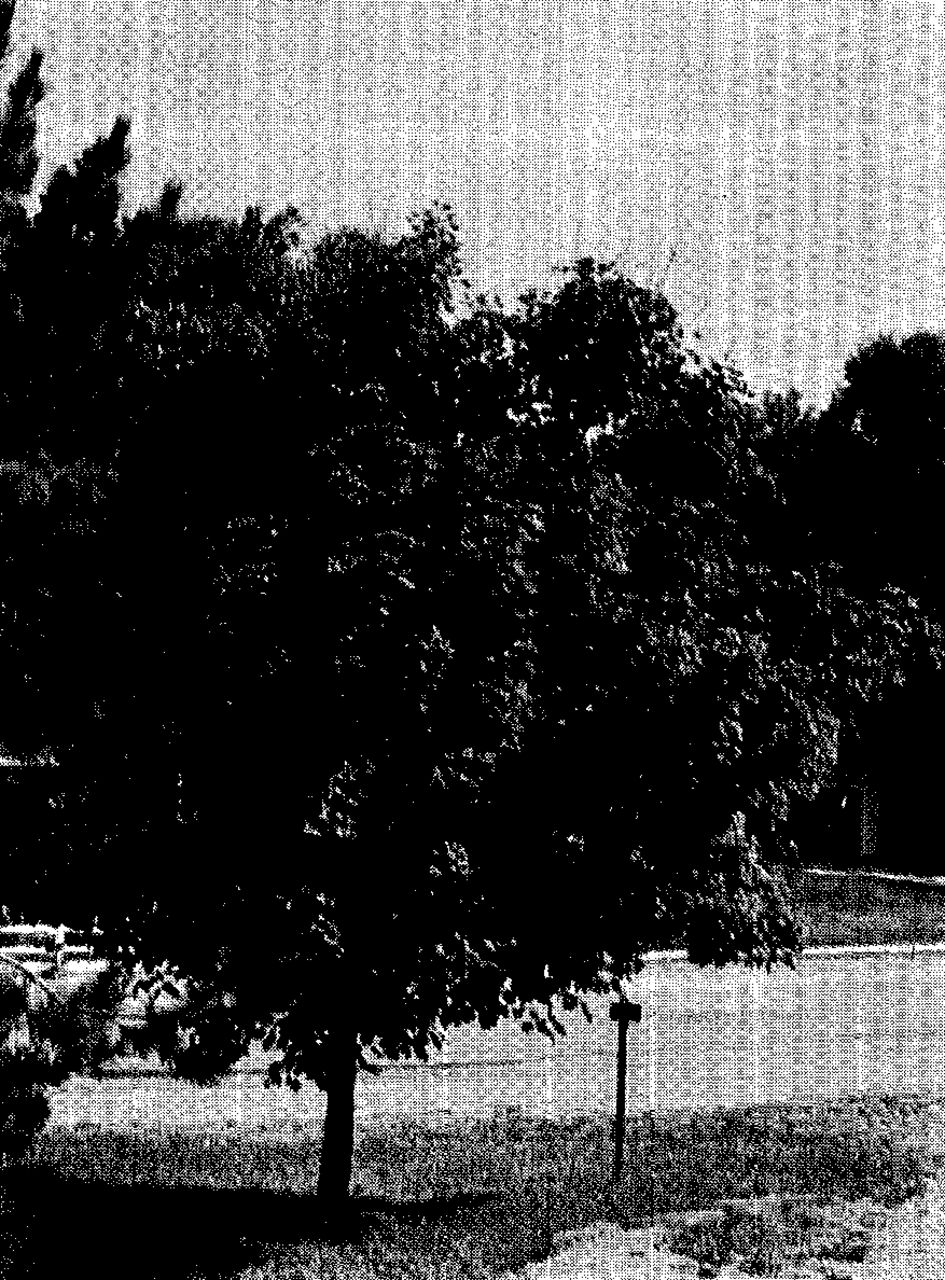
Sugar maple chlorosis in Michigan. Symptoms before and after manganese treatments. Crown symptoms (upper left). Leaf chlorosis and recovery (upper right). Crown recovery (lower left). Nino Mauro and Jim Kielbaso examine a maple treated 45 days earlier with a manganese trunk implant (lower right).


Tables
- Table I.
Average nutrient levels of healthy and chlorotic maples. (Rogers City, Ml(September 2, 1971
Chlorotic (6) Healthy (3) % N 1.76 1.90 K .79 .70 P .24 .24 Ca 1.88 1.92 Mg .22 .18 ppm Na 130 78 Mn 14 30 Fe 32 37 Cu 4 6 B 55 38 Zn 12 13 Al 59 57 ppm Sample pH Zn Mn Fe 1 7.7 19.2 16 60 2 7.7 30.0 22 52 3 8.0 5.6 14 28 4 7.6 5.6 13 28 5 7.6 6.8 10 44 Mean 7.72 13.4 15.0 45.6 - Table III.
Color response of five sugar maple trees 50 days after treatment with various Sequestrene* chelated micronutrients. (Rogers City, Ml) 1972
Treatment Rate tsp/gal June Av Color August Av Color Average Improvement Mn ½ 5.6 8.6 3.0 Zn 1½ 4.6 4.6 0.0 Cu ¾ 3.8 3.8 0.0 GA5-111 4 oz. 5.0 7.4 2.4 Fe330 1½ 4.0 4.6 .6 Control — 3.8 3.8 0.0 Mn(liquid) 1½ 4.8 7.2 2.4 Mg ½ 4.6 4.2 -0.4 Mn 1½ 5.2 8.0 2.8 Zn 3 5.0 5.2 0.2 Fe138 ½ 5.0 5.4 0.4 ↵* Sequestrene is a registered Ciba-Geigy Corporation trade mark. Rates tested as suggested by manufacturer.
- Table IV.
Comparison of mean nutrient content of sugar maple leaves by response to micro-nutrient treatment. (Rogers City, Ml) August 3,1972.
No Response (Chlorotic) Response (Green) % P .39 .31 Cu 1.99 2.34 Mg .24 .23 ppm Na 151.1 170.5 Mn 2.1 17.9 Fe 35.2 28.3 Cu 9.8 7.7 B 57.7 71.2 Zn 20.7 16.8 Al 54.2 49.2 - Table VI.
Greening effect of various manganese treatments1 to chlorotic maples in June, 1974 as recorded June, 1975
Location and Treatment1 Number of Trees Average One-Year Improvement Leaf Color Ratings 6/74 6/75 Flint MnSO4 28% 4 4.875 7.125 2.25 Mn chelate 4 5.125 5.25 .125 Check 4 6.0 5.125 -.875 Complete 2 6.25 7.0 .75 Saginaw MnSO4 28% 6 4.75 6.66 1.91 Mn chelate 5 5.2 5.4 .20 Check 4 5.5 4.5 -1.00 Complete 3 4.83 4.83 0.00 Alpena MnSO4 28% 7 4.07 6.64 2.57 Mn chelate 7 4.07 5.21 1.14 Check 5 4.20 4.70 .50 Complete 3 4.83 6.33 1.50 Rogers City MnSO4 28% 7 4.0 5.214 1.214 Mn chelate 5 4.6 6.10 1.50 Check 4 4.875 5.625 .75 Complete 2 4.75 6.0 1.25 Lansing MnSO428% 4 4.25 7.0 2.75 Mn chelate 4 4.75 4.875 .125 Check 3 4.833 4.833 0.00 Complete 2 4.5 5.5 1.00 Average MnSO4 28% 28 4.399 6.410 2.071 Mn chelate 25 4.680 5.380 .700 Check 20 5.050 4.950 .10 Complete 12 5.00 5.875 875 ↵1 Treatments were: Mn-SO4-28% soluble encapsulated (Medicaps, Creative Sales, Fremont, Nebraska); Mn chelate and complete were liquid injections.
In this issue


Jump to section
Related Articles
Cited By...
- No citing articles found.